AI Quick Summary
PhosNetVis is a web-based tool designed for kinase enrichment analysis and interactive 2D/3D visualization of phosphoproteomics data, addressing the need for streamlined kinase-substrate interaction network exploration. It facilitates user-friendly analysis and communication of phosphoproteomics datasets, lowering barriers for researchers.
Paper Preview
Abstract
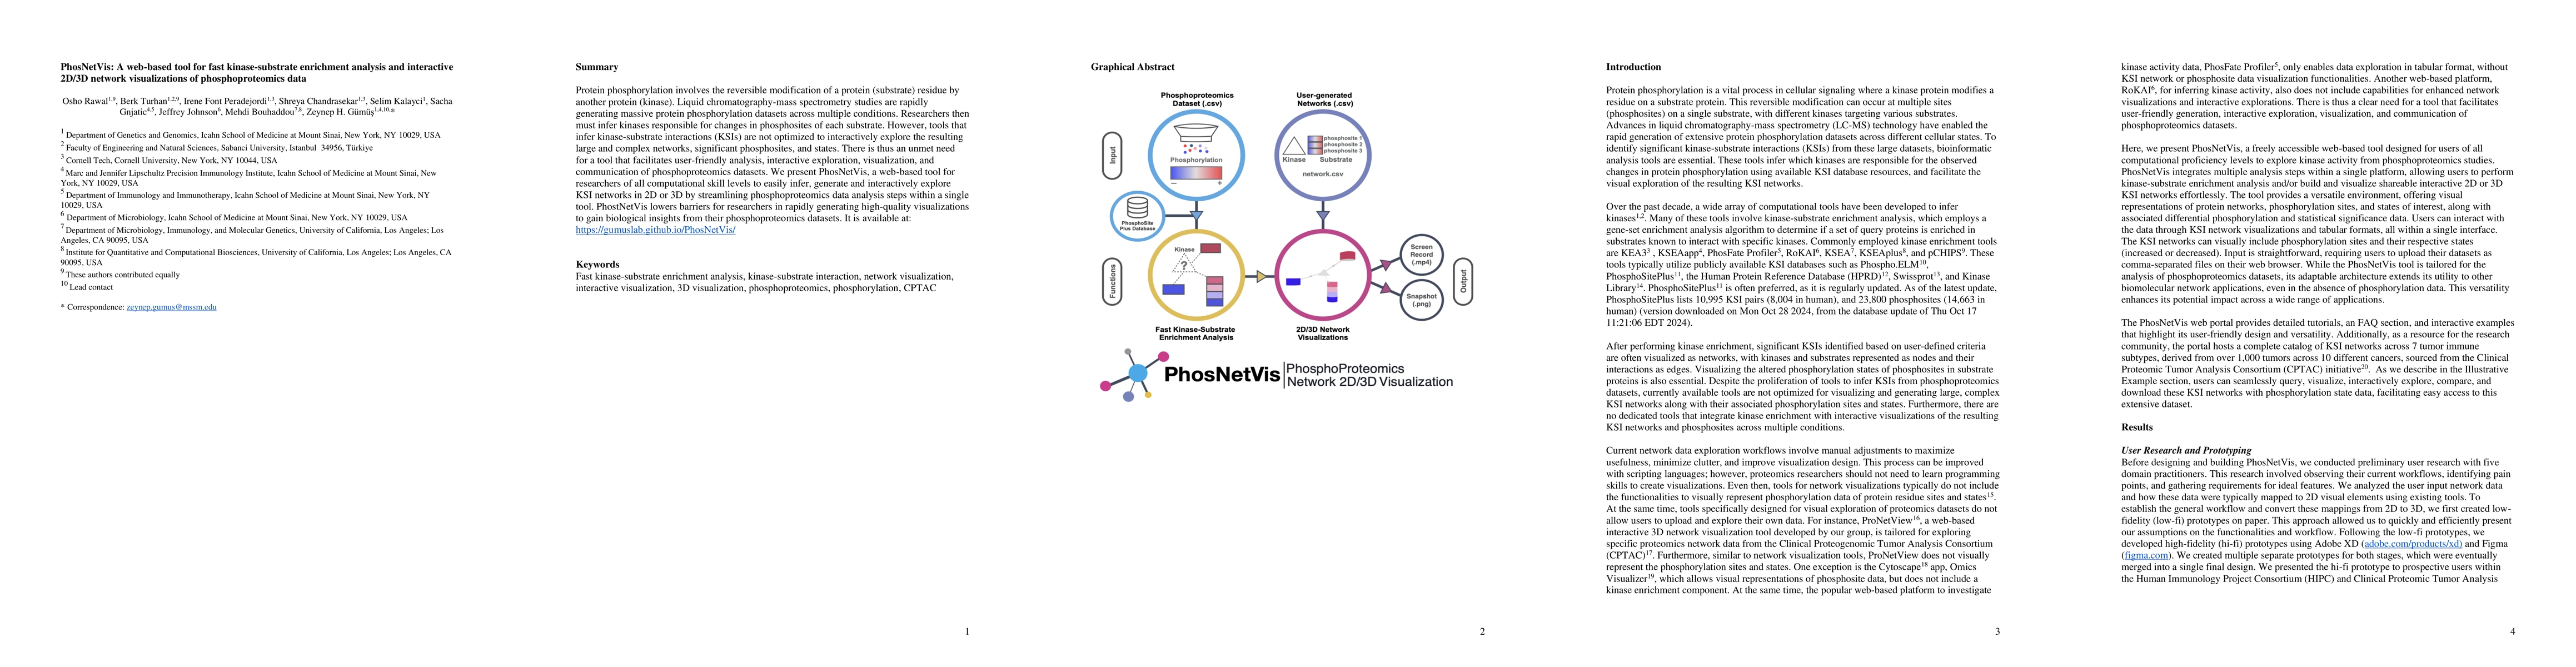
Protein phosphorylation is a vital process in cellular signaling that involves the reversible modification of a protein (substrate) residue by another protein (kinase). Advances in liquid chromatography-mass spectrometry have enabled the rapid generation of massive protein phosphorylation datasets across multiple conditions by many research groups. Researchers are then tasked with inferring kinases responsible for changes in phosphorylation sites of each substrate. Despite the recent explosion of tools to infer kinase-substrate interactions (KSIs) from such datasets, these are not optimized for the interactive exploration of the resulting large and complex KSI networks together with significant phosphorylation sites and states. There are also no dedicated tools that streamline kinase inferences together with interactive visualizations of the resulting networks. There is thus an unmet need for a tool that facilitates uster-intuitive analysis, interactive exploration, visualization, and communication of datasets from phosphoproteomics experiments. Here, we present PhosNetVis, a freely available web-based tool for researchers of all computational skill levels to easily infer, generate and interactively explore KSI networks in 2D or 3D by streamlining multiple phosphoproteomics data analysis steps within one single tool. PhostNetVis significantly lowers the barriers for researchers in rapidly generating high-quality visualizations to translate their rich phosphoproteomics datasets into biological and clinical insights.
AI Key Findings
Get AI-generated insights about this paper's methodology, results, and significance.
Paper Details
How to Cite This Paper
@article{anon2024phosnetvis,
  title         = {PhosNetVis: a web-based tool for kinase enrichment analysis and
  interactive 2D/3D network visualizations of phosphoproteomics data},
  year          = {2024},
  eprint        = {2402.05016},
  archivePrefix = {arXiv},
  primaryClass  = {q-bio.MN},
}(2024). PhosNetVis: a web-based tool for kinase enrichment analysis and
interactive 2D/3D network visualizations of phosphoproteomics data. arXiv. https://arxiv.org/abs/2402.05016"PhosNetVis: a web-based tool for kinase enrichment analysis and
interactive 2D/3D network visualizations of phosphoproteomics data." arXiv, 2024, arxiv.org/abs/2402.05016.PDF Preview
Key Terms
Citation Network
Current paper (gray), citations (green), references (blue)
Display is limited for performance on very large graphs.
Similar Papers
Found 4 papersDASH: A Bimodal Data Exploration Tool for Interactive Text and Visualizations
Dennis Bromley, Vidya Setlur
The Language Interpretability Tool: Extensible, Interactive Visualizations and Analysis for NLP Models
Mahima Pushkarna, Ian Tenney, Jasmijn Bastings et al.
Firefly: a browser-based interactive 3D data visualization tool for millions of data points
Aaron M. Geller, Alexander B. Gurvich
No citations found for this paper.
Comments (0)