Publication
Metrics
AI Quick Summary
This paper proposes a two-stage method combining KNN and SVM to improve photometric redshift estimation for quasars, addressing catastrophic failure in current approaches. The KNN method identifies dense failure regions, while SVM in the second stage corrects these by mapping data into a high-dimensional feature space, significantly improving accuracy.
Paper Preview
Abstract
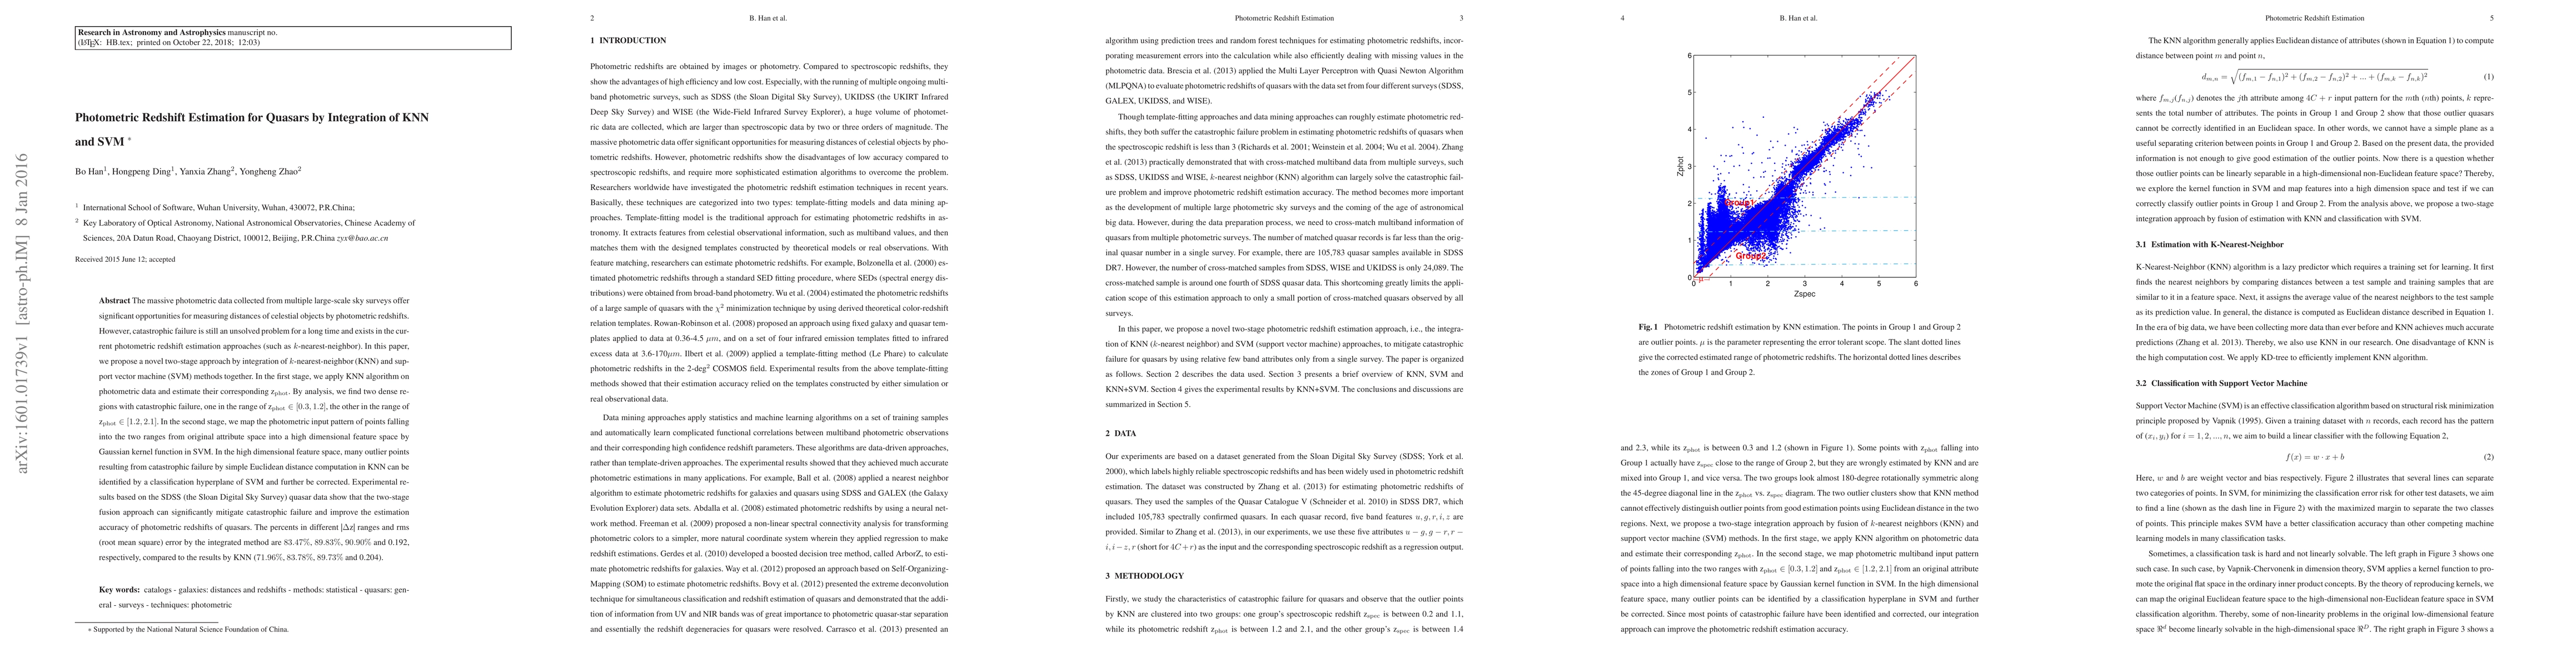
The massive photometric data collected from multiple large-scale sky surveys offer significant opportunities for measuring distances of celestial objects by photometric redshifts. However, catastrophic failure is still an unsolved problem for a long time and exists in the current photometric redshift estimation approaches (such as $k$-nearest-neighbor). In this paper, we propose a novel two-stage approach by integration of $k$-nearest-neighbor (KNN) and support vector machine (SVM) methods together. In the first stage, we apply KNN algorithm on photometric data and estimate their corresponding z$_{\rm phot}$. By analysis, we find two dense regions with catastrophic failure, one in the range of z$_{\rm phot}\in[0.3,1.2]$, the other in the range of z$_{\rm phot}\in [1.2,2.1]$. In the second stage, we map the photometric input pattern of points falling into the two ranges from original attribute space into a high dimensional feature space by Gaussian kernel function in SVM. In the high dimensional feature space, many outlier points resulting from catastrophic failure by simple Euclidean distance computation in KNN can be identified by a classification hyperplane of SVM and further be corrected. Experimental results based on the SDSS (the Sloan Digital Sky Survey) quasar data show that the two-stage fusion approach can significantly mitigate catastrophic failure and improve the estimation accuracy of photometric redshifts of quasars. The percents in different |$\Delta$z| ranges and rms (root mean square) error by the integrated method are $83.47\%$, $89.83\%$, $90.90\%$ and 0.192, respectively, compared to the results by KNN ($71.96\%$, $83.78\%$, $89.73\%$ and 0.204).
AI Key Findings
Get AI-generated insights about this paper's methodology, results, significance, and more — seven facets brought into focus.
Impact
Paper Details
PDF Preview
Key Terms
Citation Network
Current paper (gray), citations (green), references (blue)
Display is limited for performance on very large graphs.
Discussion 0