Publication
Metrics
AI Quick Summary
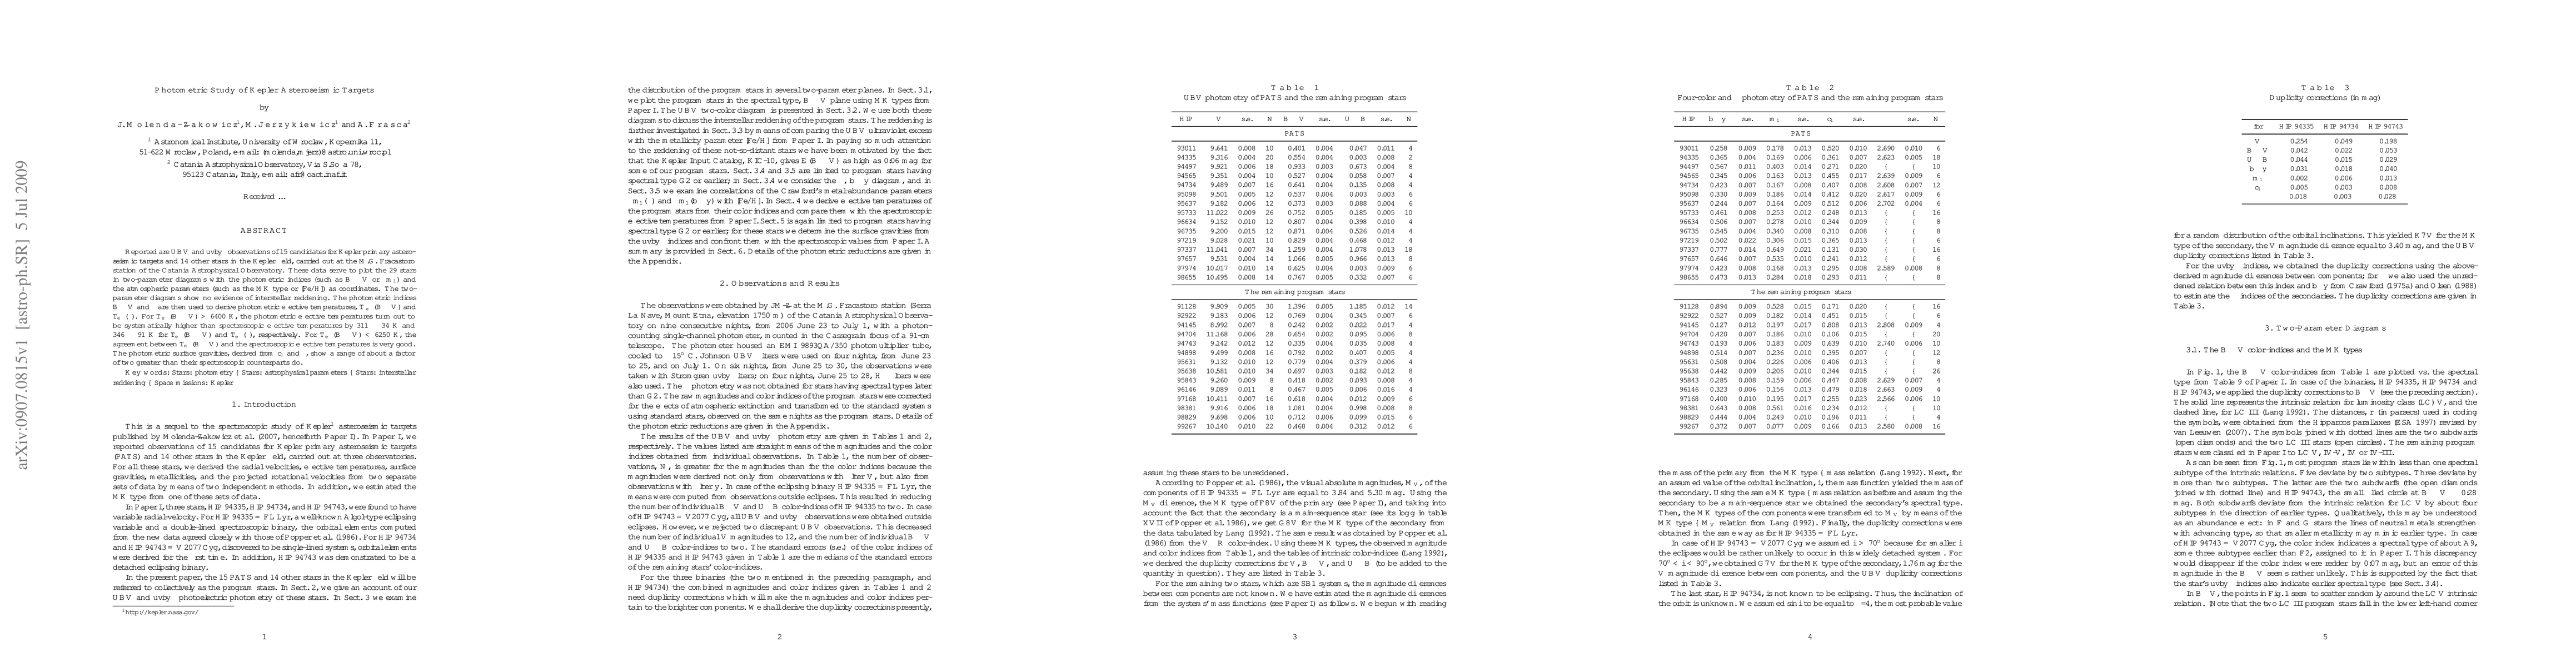
This study reports UBV and uvbybeta photometric observations of 29 stars, including 15 Kepler asteroseismic targets, revealing no evidence of interstellar reddening. Photometric effective temperatures show systematic discrepancies compared to spectroscopic values, with notable differences for stars with Teff(B-V) > 6400 K.
Paper Preview
Abstract
Reported are UBV and uvbybeta observations of 15 candidates for Kepler primary astero- seismic targets and 14 other stars in the Kepler field, carried out at the M.G. Fracastoro station of the Catania Astrophysical Observatory. These data serve to plot the 29 stars in two-parameter diagrams with the photometric indices (such as B-V or delta m1 and the atmospheric parameters (such as the MK type or [Fe/H]) as coordinates. The two-parameter diagrams show no evidence of interstellar reddening. The photometric indices B-V and beta are then used to derive photometric effective temperatures, Teff(B-V) and Teff(beta). For Teff(B-V) > 6400 K, the photometric effective temperatures turn out to be systematically higher than spectroscopic effective temperatures by 311 +/- 34 K and 346 +/- 91 K for Teff(B-V) and Teff(beta), respectively. For T_eff(B-V) < 6250 K, the agreement between Teff(B-V) and the spectroscopic effective temperatures is very good. The photometric surface gravities, derived from c_1 and beta, show a range of about a factor of two greater than their spectroscopic counterparts do.
AI Key Findings
Get AI-generated insights about this paper's methodology, results, significance, and more — seven facets brought into focus.
Impact
Paper Details
PDF Preview
Key Terms
Citation Network
Current paper (gray), citations (green), references (blue)
Display is limited for performance on very large graphs.
Discussion 0