Summary
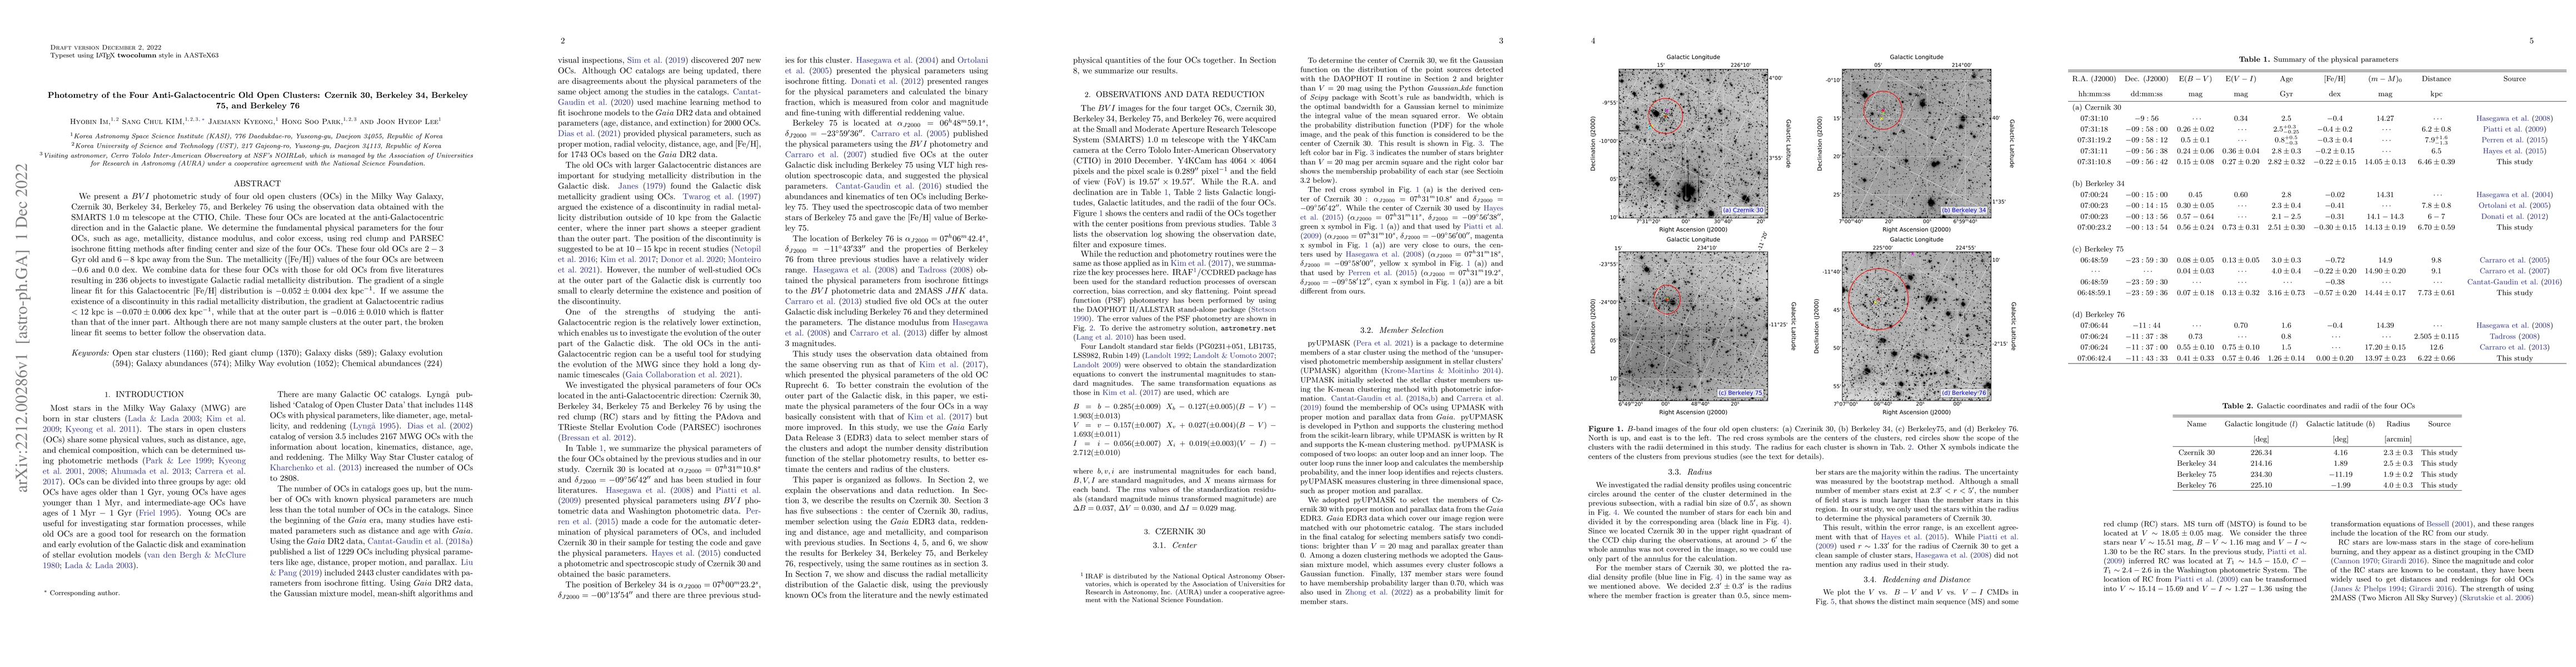
We present a BVI photometric study of four old open clusters (OCs) in the Milky Way Galaxy, Czernik 30, Berkeley 34, Berkeley 75, and Berkeley 76 using the observation data obtained with the SMARTS 1.0 m telescope at the CTIO, Chile. These four OCs are located at the anti-Galactocentric direction and in the Galactic plane. We determine the fundamental physical parameters for the four OCs, such as age, metallicity, distance modulus, and color excess, using red clump and PARSEC isochrone fitting methods after finding center and size of the four OCs. These four old OCs are 2-3 Gyr old and 6 - 8 kpc away from the Sun. The metallicity ([Fe/H]) values of the four OCs are between -0.6 and 0.0 dex. We combine data for these four OCs with those for old OCs from five literatures resulting in 236 objects to investigate Galactic radial metallicity distribution. The gradient of a single linear fit for this Galactocentric [Fe/H] distribution is -0.052 +/- 0.004 dex/kpc. If we assume the existence of a discontinuity in this radial metallicity distribution, the gradient at Galactocentric radius < 12 kpc is -0.070 +/- 0.006 dex/kpc, while that at the outer part is -0.016 +/- 0.010 which is flatter than that of the inner part. Although there are not many sample clusters at the outer part, the broken linear fit seems to better follow the observation data.
AI Key Findings
Get AI-generated insights about this paper's methodology, results, and significance.
Paper Details
PDF Preview
Key Terms
Citation Network
Current paper (gray), citations (green), references (blue)
Display is limited for performance on very large graphs.
Similar Papers
Found 4 papersNo citations found for this paper.
Comments (0)