ArxivLens

Quick Summary:

This study investigates the cross-correlation of gamma-ray, X-ray, and optical variability in a sample of 26 blazars, finding consistent inter-band correlations with negligible time lag. The results support a leptonic model suggesting emission regions of approximately 0.1 pc for low synchrotron peaked blazars and larger regions for high synchrotron peaked blazars.

DOI: 10.1093/mnras/stz2557
arXiv Id: 1909.05157
Date Published: 2020-04-08
Date Updated: 2020-04-08

Key Terms (TF-IDF):

broad line (0.226)
variability (0.224)
subgroups (0.217)
variability (0.216)
subgroups (0.215)
region (0.209)
gauss (0.208)
synchrotron (0.203)
gauss (0.200)
emission (0.199)
region (0.198)
synchrotron (0.194)
emission (0.190)
cross (0.173)
correlation (0.172)
cross (0.169)
correlation (0.169)
broad (0.167)
broad (0.162)
band (0.150)
License: http://creativecommons.org/licenses/by/4.0/

Summary:

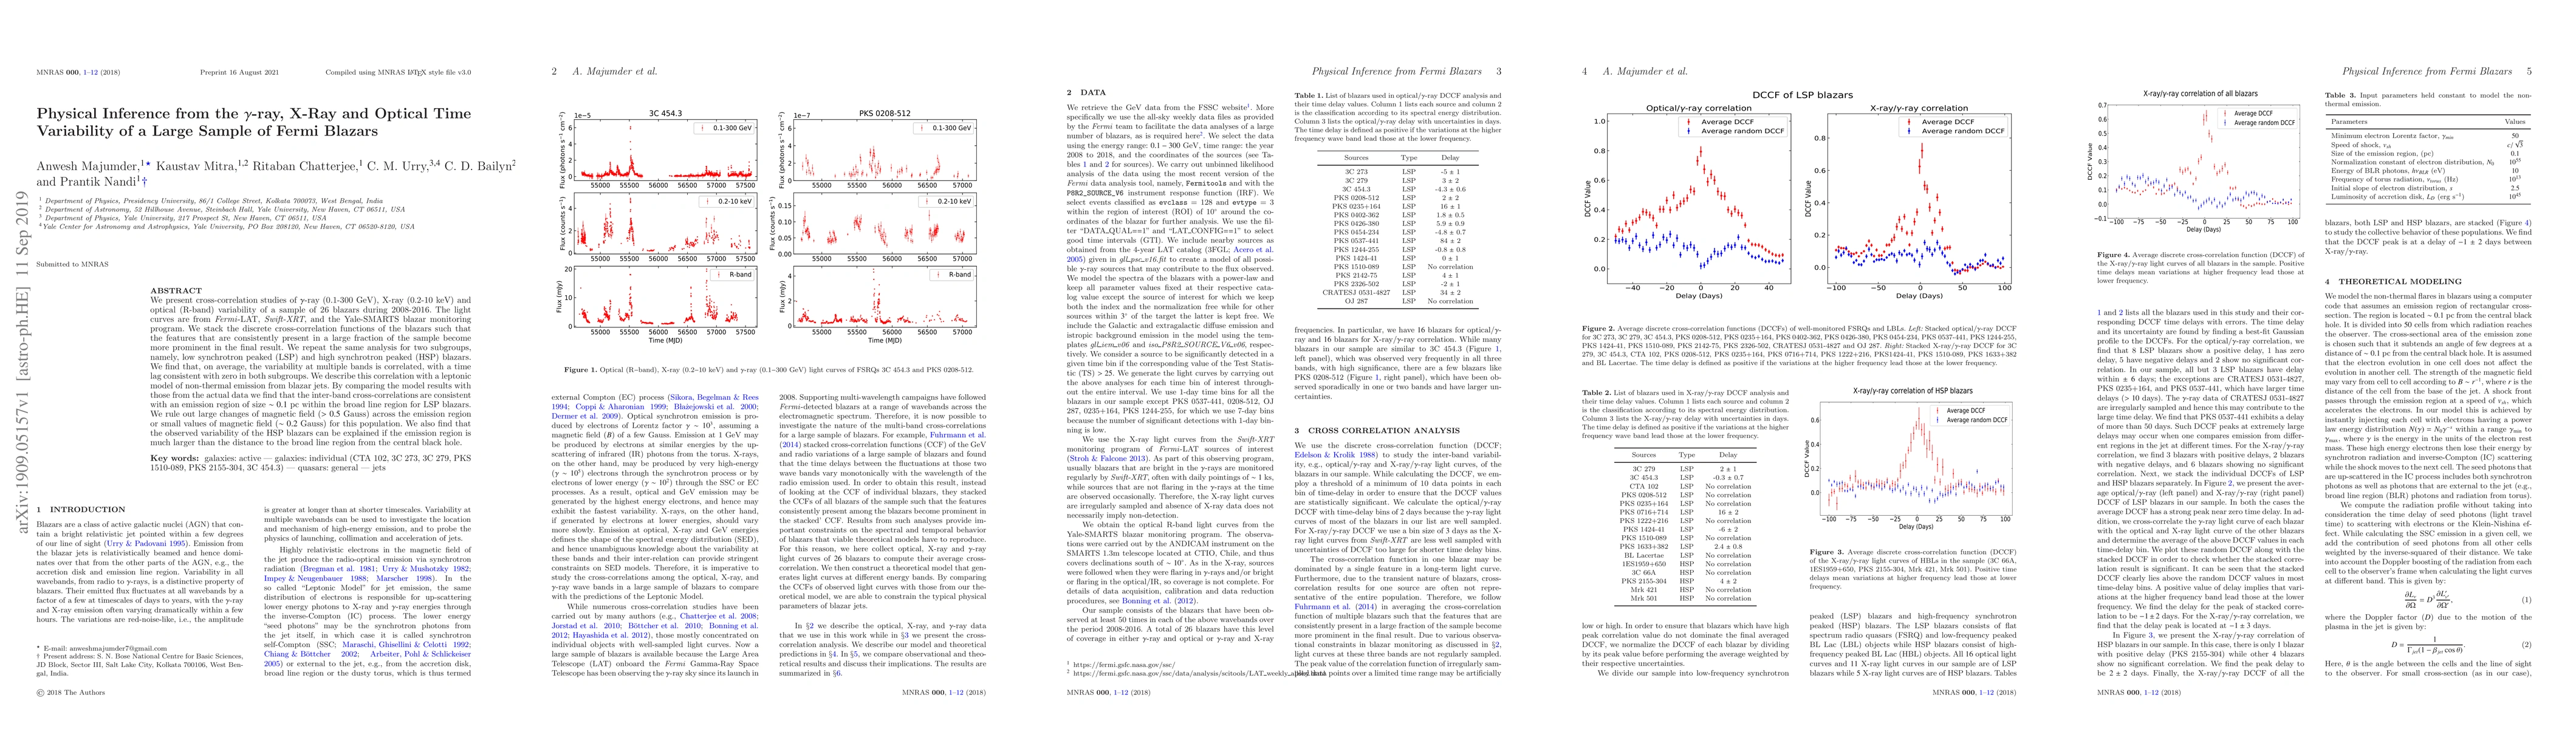
We present cross-correlation studies of gamma-ray (0.1-300 GeV), X-ray (0.2-10 keV) and optical (R-band) variability of a sample of 26 blazars during 2008-2016. The light curves are from Fermi-LAT, Swift-XRT, and the Yale-SMARTS blazar monitoring program. We stack the discrete cross-correlation functions of the blazars such that the features that are consistently present in a large fraction of the sample become more prominent in the final result. We repeat the same analysis for two subgroups, namely, low synchrotron peaked (LSP) and high synchrotron peaked (HSP) blazars. We find that, on average, the variability at multiple bands is correlated, with a time lag consistent with zero in both subgroups. We describe this correlation with a leptonic model of non-thermal emission from blazar jets. By comparing the model results with those from the actual data we find that the inter-band cross-correlations are consistent with an emission region of size nearly 0.1 pc within the broad line region for LSP blazars. We rule out large changes of magnetic field (> 0.5 Gauss) across the emission region or small values of magnetic field (e.g. 0.2 Gauss) for this population. We also find that the observed variability of the HSP blazars can be explained if the emission region is much larger than the distance to the broad line region from the central black hole.

Citation & Reference Network Visualization

This graph shows how this paper is connected to other research. The current paper is shown in dark gray, papers that cite it are in green, and papers it references are in blue. You can:

Current Paper
Papers citing this work (Citations)
Papers cited by this work (References)

• Hover over any node to see the paper title

• Click a node to view that paper's details

• Drag nodes to rearrange the graph

• Use the zoom controls (bottom right) to zoom in/out

Citations and References

Title Authors Year Actions
Exploring TeV Candidates of Fermi Blazars through Machine Learning
J. T. Zhu, C. Lin, H. Xiao, J. H. Fan, D. Bastieri, G. G. Wang
2023
View Paper
Long-term Optical and γ-Ray Variability of the Blazar PKS 1222+216
Savithri H. Ezhikode, A. Shukla, G. Dewangan, P. Pawar, S. Agarwal, B. Mathew, A. R.
2022
View Paper
Multiband Emission Properties of 1ES 1959+650
Huai-zhen Li, Long-hua Qin, Quan-Gui Gao, T. Yi, Y. Gong, D. Guo, Yunguo Jiang, F. Lu, Ju Ma, J. Ren, Ya-li Liu
2022
View Paper
Short-timescale variability of the blazar Mrk 421 from AstroSat and simultaneous multi-wavelength observations
R. Chatterjee, Susmita Das, Archishman Khasnovis, R. Ghosh, N. Kumari, S. Naik, V. Larionov, T. Grishina, E. Kopatskaya, E. Larionova, A. Nikiforova, D. Morozov, S. Savchenko, Y. Troitskaya, I. Troitsky, A. Vasilyev
2021
View Paper

Comments (0)

This website uses cookies to ensure you get the best experience. Learn more