Physiological accuracy in simulating refractory cardiac tissue: the volume-averaged bidomain model vs. the cell-based EMI model
Publication
Metrics
AI Quick Summary
This study compares the unipolar strength-interval curves of the bidomain model and the EMI model to assess which better simulates the refractory period of cardiac tissue. The EMI model, with its detailed cell-based resolution, more accurately reflects experimental data compared to the bidomain model, suggesting its potential for improved computational simulations in anti-arrhythmic devices.
Paper Preview
Abstract
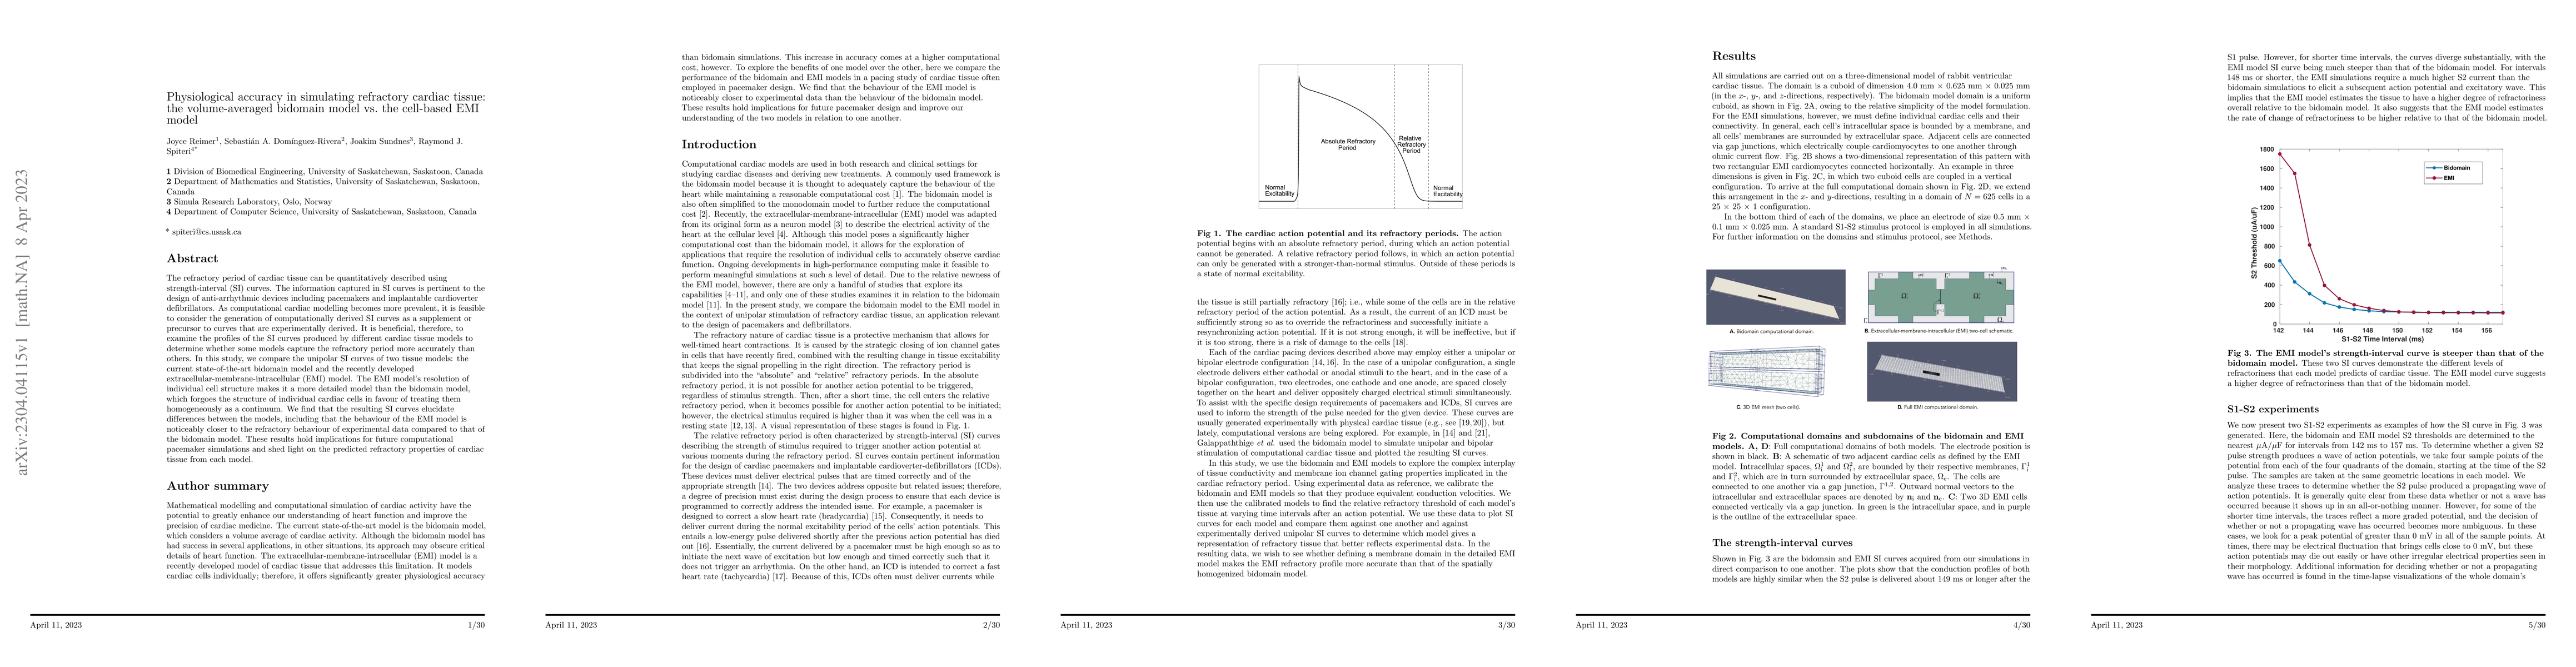
The refractory period of cardiac tissue can be quantitatively described using strength-interval (SI) curves. The information captured in SI curves is pertinent to the design of anti-arrhythmic devices including pacemakers and implantable cardioverter defibrillators. As computational cardiac modelling becomes more prevalent, it is feasible to consider the generation of computationally derived SI curves as a supplement or precursor to curves that are experimentally derived. It is beneficial, therefore, to examine the profiles of the SI curves produced by different cardiac tissue models to determine whether some models capture the refractory period more accurately than others. In this study, we compare the unipolar SI curves of two tissue models: the current state-of-the-art bidomain model and the recently developed extracellular-membrane-intracellular (EMI) model. The EMI model's resolution of individual cell structure makes it a more detailed model than the bidomain model, which forgoes the structure of individual cardiac cells in favour of treating them homogeneously as a continuum. We find that the resulting SI curves elucidate differences between the models, including that the behaviour of the EMI model is noticeably closer to the refractory behaviour of experimental data compared to that of the bidomain model. These results hold implications for future computational pacemaker simulations and shed light on the predicted refractory properties of cardiac tissue from each model.
AI Key Findings
Get AI-generated insights about this paper's methodology, results, significance, and more — seven facets brought into focus.
Impact
Paper Details
Authors
PDF Preview
Key Terms
Citation Network
Current paper (gray), citations (green), references (blue)
Display is limited for performance on very large graphs.
Discussion 0