Quick Summary:

PI2 automates the generation of fully functional visual analysis interfaces from example query sequences, leveraging a novel Difftree structure to encode query variations and map them to interactive visualizations. The system scales linearly and can reproduce or improve existing interfaces efficiently.

Summary

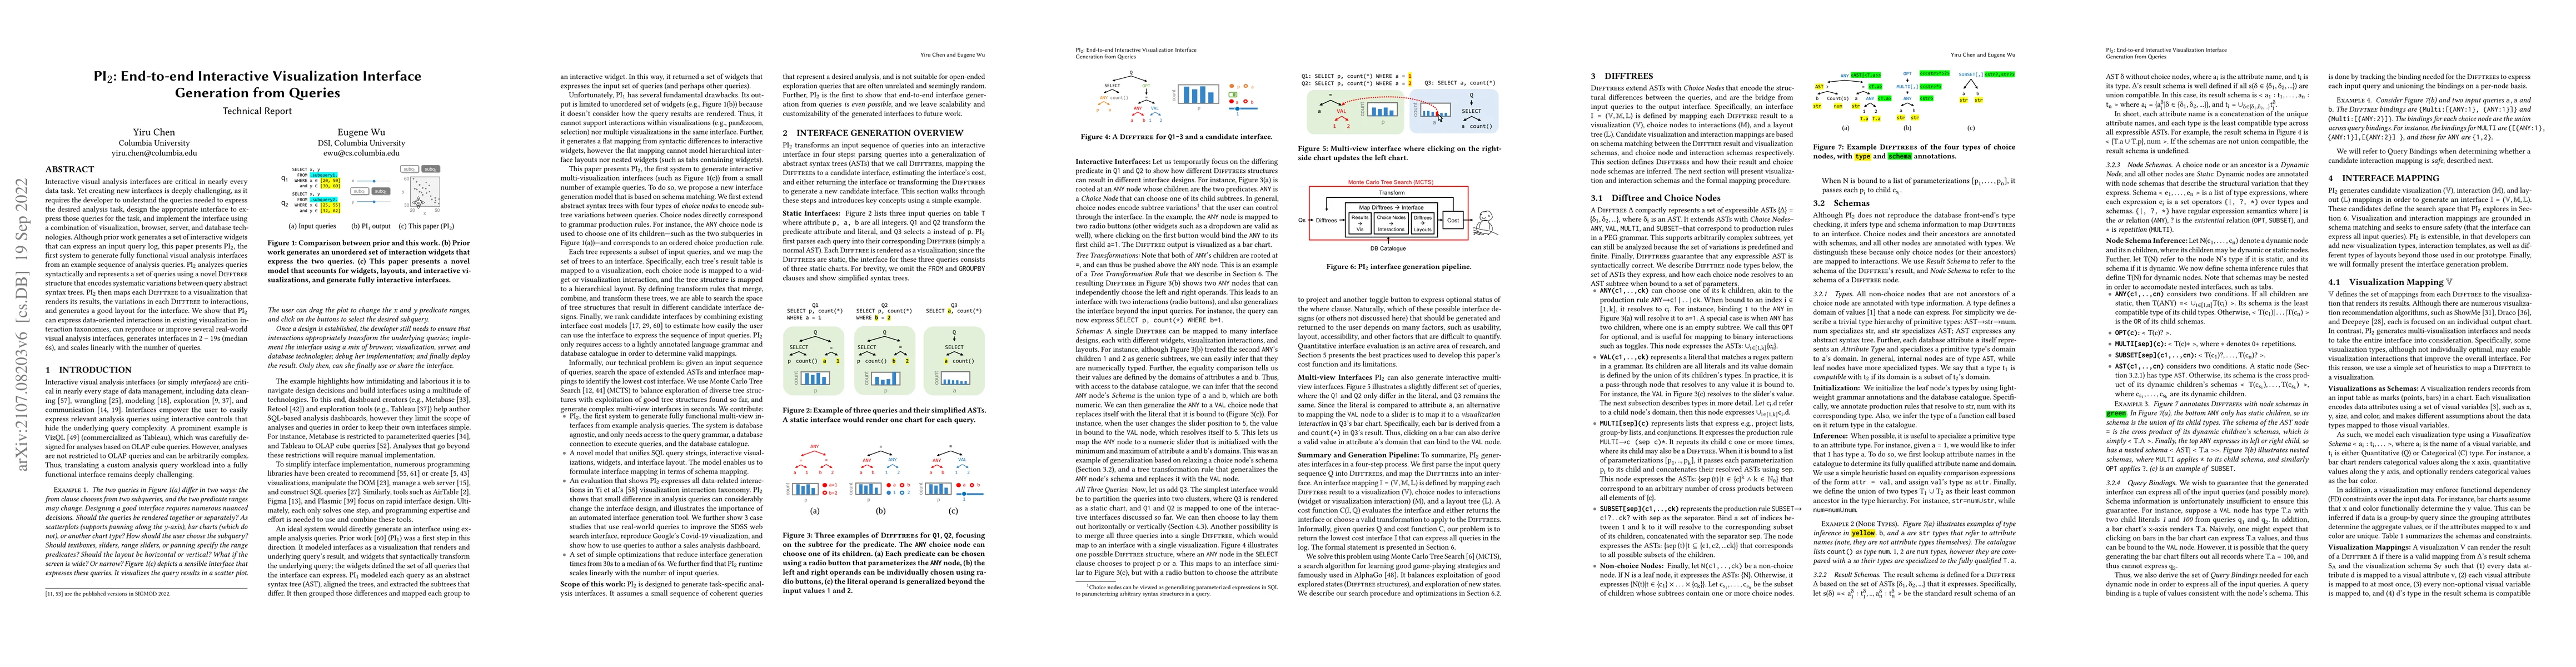
Interactive visual analysis interfaces are critical in nearly every data task. However, creating new interfaces is deeply challenging, as it requires the developer to understand the queries needed to express the desired analysis task, design the appropriate interface to express those queries for the task, and implement the interface using a combination of visualization, browser, server, and database technologies. Although prior work generates a set of interactive widgets that can express an input query log, this paper presents PI2, the first system to generate fully functional visual analysis interfaces from an example sequence of analysis queries. PI2 analyzes queries syntactically and represents a set of queries using a novel Difftree structure that encodes systematic variations between query abstract syntax trees. PI2 then maps each Difftree to a visualization that renders its results, the variations in each Difftree to interactions, and generates a good layout for the interface. We show that PI2 can express data-oriented interactions in existing visualization interaction taxonomies, reproduce or improve several real-world visual analysis interfaces, generate interfaces in 2-19s (median 6s), and scale linearly with the number of queries.

AI Key Findings

Get AI-generated insights about this paper's methodology, results, and significance.

Paper Details

PDF Preview

Download PDF

Key Terms

queries (0.331)
queries (0.322)
interfaces (0.318)
interfaces (0.286)
express (0.277)
visualization (0.260)
interactive (0.214)
interface (0.212)
interactive (0.209)
interface (0.204)
visual (0.203)
visual (0.201)
query (0.190)
query (0.188)
generates (0.182)
generates (0.178)
task (0.167)
task (0.163)
variations (0.162)
variations (0.160)

Citation Network

Current paper (gray), citations (green), references (blue)

Current Paper
Citations
References
Click to view
Title Authors Year Actions
NoteFlow: Recommending Charts as Sight Glasses for Tracing Data Flow in Computational Notebooks
Yuan Tian, Dazhen Deng, Sen Yang, Huawei Zheng, Bowen Shi, Kai Xiong, Xinjing Yi, Yingcai Wu
2025
View Paper
Design-Specific Transformations in Visualization
Eugene Wu, Remco Chang
2024
View Paper
V-RECS, a Low-Cost LLM4VIS Recommender with Explanations, Captioning and Suggestions
L. Podo, M. Angelini, Paola Velardi
2024
View Paper
HAIChart: Human and AI Paired Visualization System
Yupeng Xie, Yuyu Luo, Guoliang Li, Nan Tang
2024
View Paper
Vi(E)va LLM! A Conceptual Stack for Evaluating and Interpreting Generative AI-based Visualizations
L. Podo, M. Ishmal, M. Angelini
2024
View Paper
DynaVis: Dynamically Synthesized UI Widgets for Visualization Editing
Priyan Vaithilingam, Elena L. Glassman, J. Inala, Chenglong Wang
2024
View Paper
Mosaic: An Architecture for Scalable & Interoperable Data Views
Jeffrey Heer, Dominik Moritz
2023
View Paper
InkSight: Leveraging Sketch Interaction for Documenting Chart Findings in Computational Notebooks
Yanna Lin, Haotian Li, Leni Yang, Aoyu Wu, Huamin Qu
2023
View Paper
DIG: The Data Interface Grammar
Yiru Chen, Jeffery Tao, Eugene Wu
2023
View Paper
SuperNOVA: Design Strategies and Opportunities for Interactive Visualization in Computational Notebooks
Zijie J. Wang, David Munechika, Seongmin Lee, Duen Horng Chau
2023
View Paper
How Data Analysts Use a Visualization Grammar in Practice
Xiaoying Pu, M. Kay
2023
View Paper
Notable: On-the-fly Assistant for Data Storytelling in Computational Notebooks
Haotian Li, Lu Ying, Haidong Zhang, Yingcai Wu, Huamin Qu, Yun Wang
2023
View Paper
Agnostic Visual Recommendation Systems: Open Challenges and Future Directions
L. Podo, Bardh Prenkaj, P. Velardi
2023
View Paper
How Do Data Science Workers Communicate Intermediate Results?
Rock Yuren Pang, Ruotong Wang, Joely Nelson, L. Battle
2022
View Paper
NL2INTERFACE: Interactive Visualization Interface Generation from Natural Language Queries
Yiru Chen, Ryan Li, Austin Mac, Tianbao Xie, Tao Yu, Eugene Wu
2022
View Paper
From BERT to GPT-3 Codex: Harnessing the Potential of Very Large Language Models for Data Management
Immanuel Trummer
2022
View Paper
An Adaptive Benchmark for Modeling User Exploration of Large Datasets
Joanna Purich, Hira Mahmood, Diana Chou, Chidi Udeze, L. Battle
2022
View Paper
Demonstration of PI2: Interactive Visualization Interface Generation for SQL Analysis in Notebook
Jeffrey Tao, Yiru Chen, Eugene Wu
2022
View Paper
Toward a Structured Theoretical Framework for the Evaluation of Generative AI-based Visualizations
L. Podo, M. Ishmal, M. Angelini
2024
View Paper
Intelligent Data Visualization Analysis Techniques: A Survey
Yu-Yu Luo, Xue-Di Qin, Yu-Peng Xie, Guo-Liang Li
View Paper
HiLT: A Framework for Generating Human-in-the-Loop Data Transformation GUIs
View Paper

Comments (0)

This website uses cookies to ensure you get the best experience. Learn more