As the volume of data available from sensor-enabled devices such as vehicles
expands, it is increasingly hard for companies to make informed decisions about
the cost of capturing, processing, and storing the data from every device.
Business teams may forecast costs associated with deployments and use patterns
of devices that they sell, yet lack ways of forecasting the cost and
performance of the data pipelines needed to support their devices. Without such
forecasting, a company's safest choice is to make worst-case capacity
estimates, and pay for overprovisioned infrastructure. Existing data pipeline
benchmarking tools can measure latency, cost, and throughput as needed for
development, but cannot easily close the gap in communicating the implications
with business teams to inform cost forecasting. In this paper, we introduce an
open-source tool, PlantD, a harness for measuring data pipelines as they are
being developed, and for interpreting that data in a business context. PlantD
collects a complete suite of metrics and visualizations, when developing or
evaluating data pipeline architectures, configurations, and business use cases.
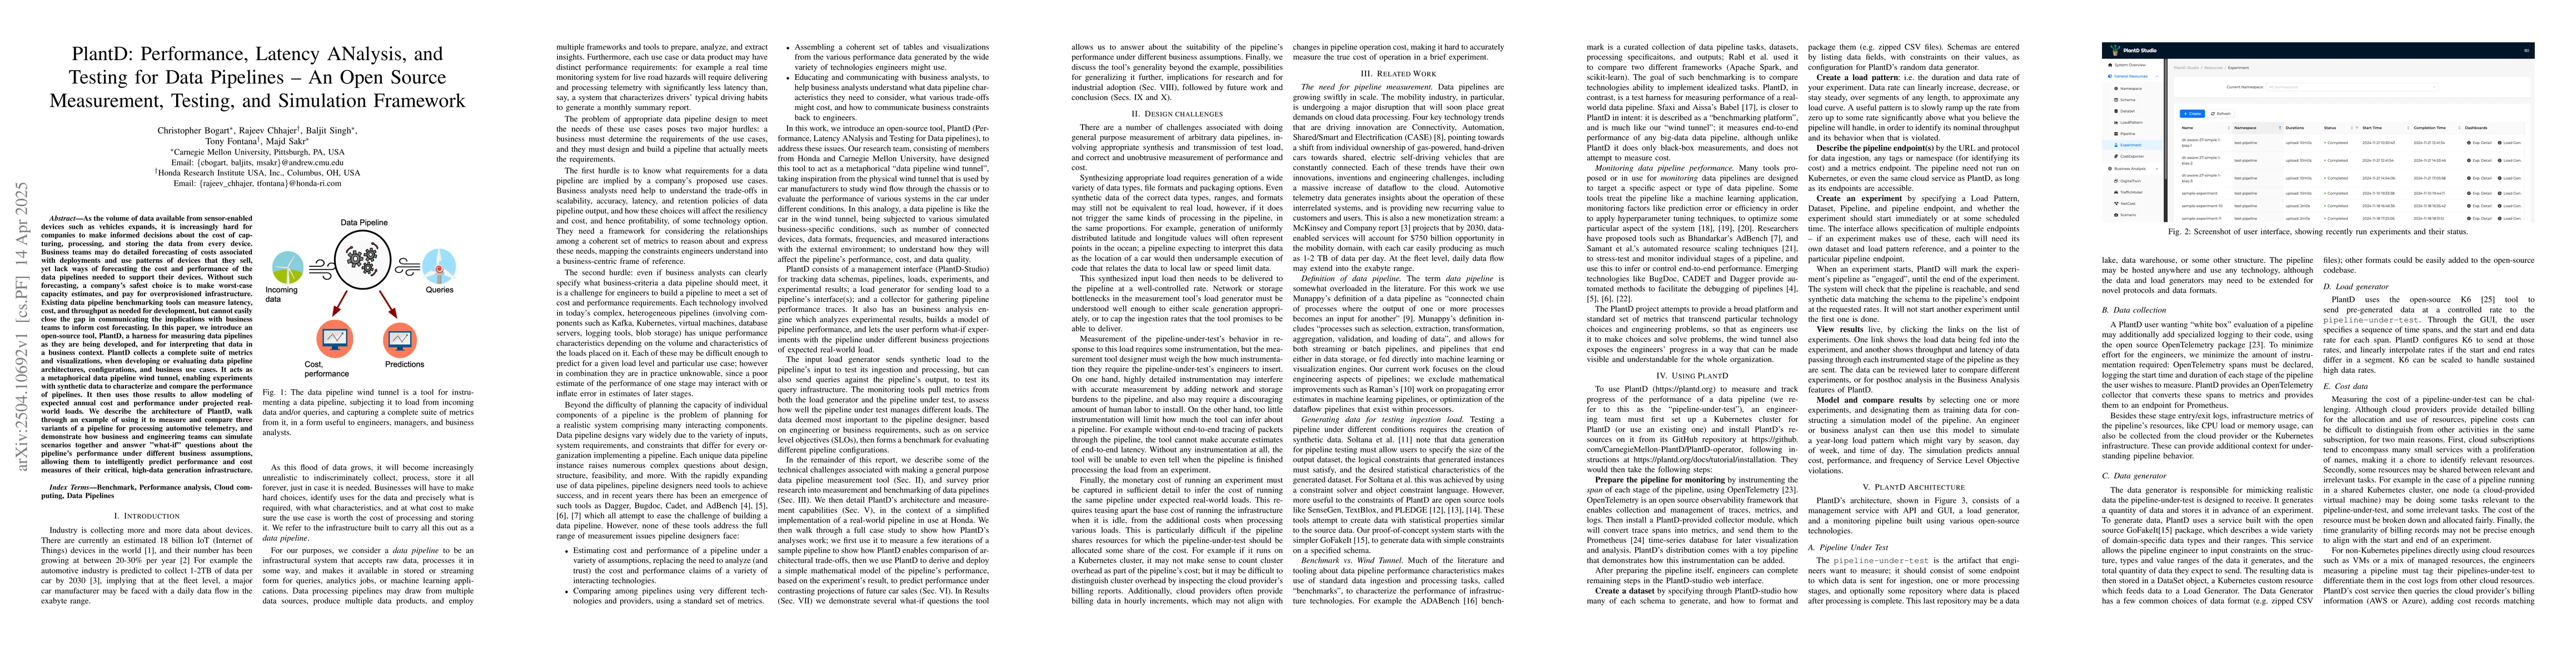
It acts as a metaphorical data pipeline wind tunnel, enabling experiments with
synthetic data to characterize and compare the performance of pipelines. It
then uses those results to allow modeling of expected annual cost and
performance under projected real-world loads. We describe the architecture of
PlantD, walk through an example of using it to measure and compare three
variants of a pipeline for processing automotive telemetry, and demonstrate how
business and engineering teams can simulate scenarios together and answer
"what-if" questions about the pipeline's performance under different business
assumptions, allowing them to intelligently predict performance and cost
measures of their critical, high-data generation infrastructure.
Discussion 0