Summary
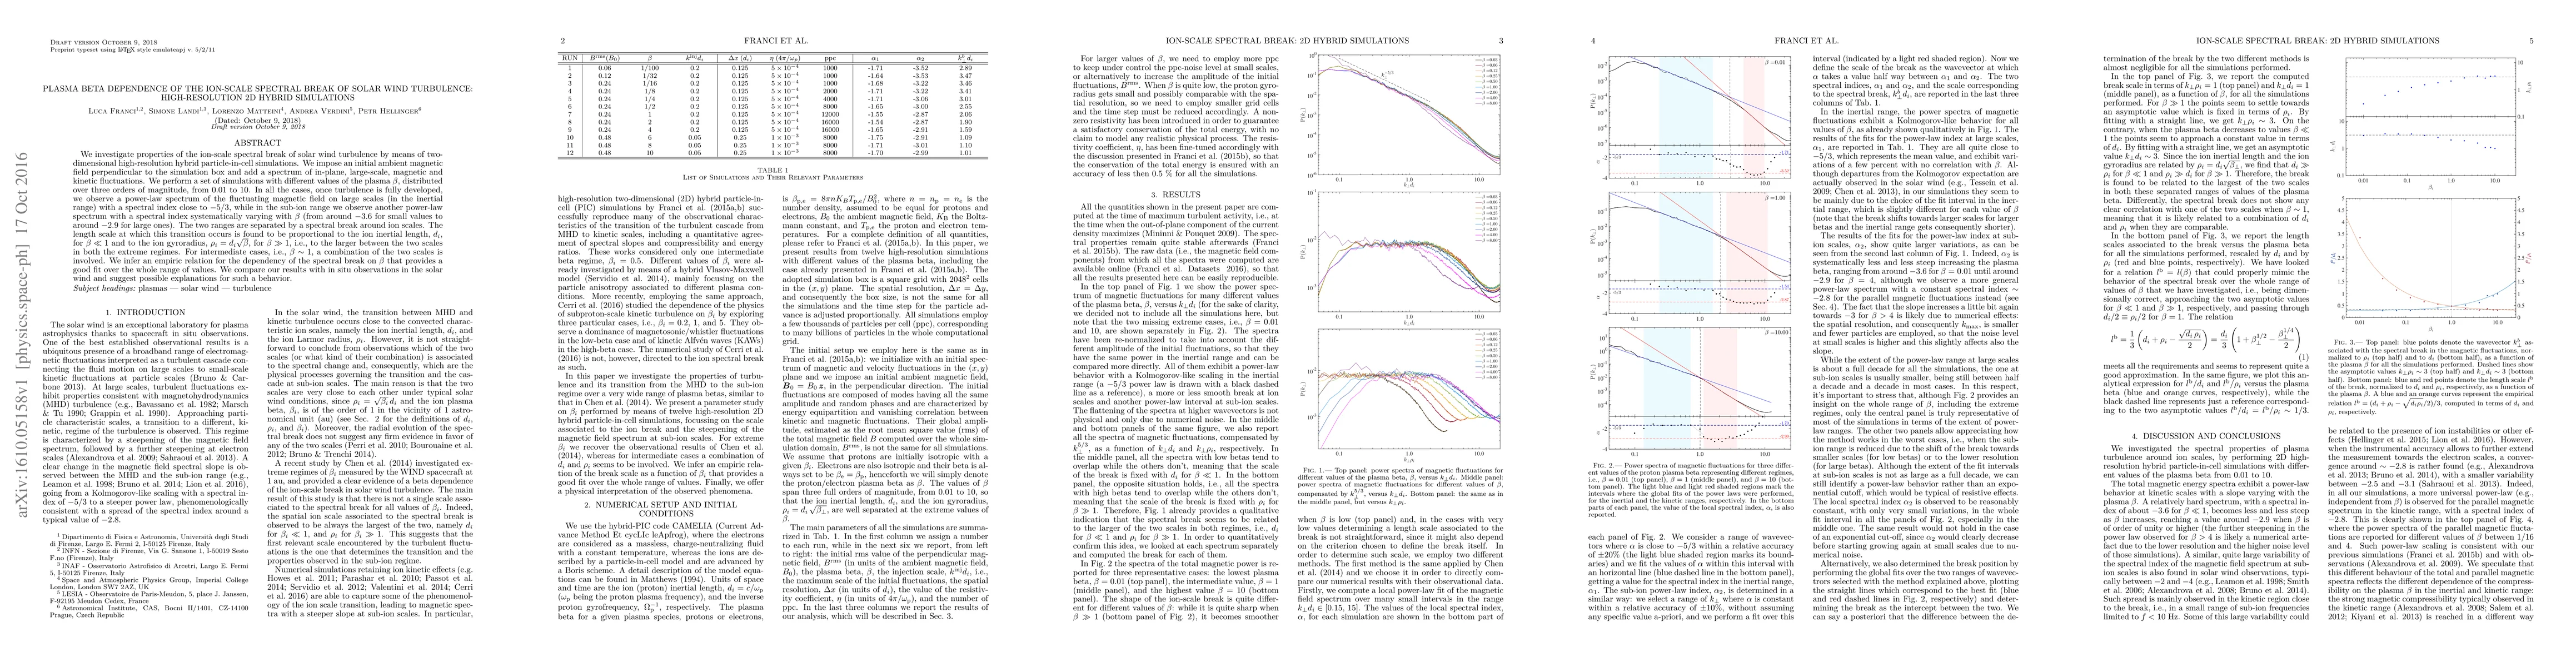
We investigate properties of the ion-scale spectral break of solar wind turbulence by means of two-dimensional high-resolution hybrid particle-in-cell simulations. We impose an initial ambient magnetic field perpendicular to the simulation box and add a spectrum of in-plane, large-scale, magnetic and kinetic fluctuations. We perform a set of simulations with different values of the plasma beta, distributed over three orders of magnitude, from 0.01 to 10. In all the cases, once turbulence is fully developed, we observe a power-law spectrum of the fluctuating magnetic field on large scales (in the inertial range) with a spectral index close to -5/3, while in the sub-ion range we observe another power-law spectrum with a spectral index systematically varying with $\beta$ (from around -3.6 for small values to around -2.9 for large ones). The two ranges are separated by a spectral break around ion scales. The length scale at which this transition occurs is found to be proportional to the ion inertial length, $d_i$, for $\beta \ll 1$ and to the ion gyroradius, $\rho_i = d_i\sqrt{\beta}$, for $\beta \gg 1$, i.e., to the larger between the two scales in both the extreme regimes. For intermediate cases, i.e., $\beta \sim 1$, a combination of the two scales is involved. We infer an empiric relation for the dependency of the spectral break on $\beta$ that provides a good fit over the whole range of values. We compare our results with in situ observations in the solar wind and suggest possible explanations for such a behavior.
AI Key Findings
Get AI-generated insights about this paper's methodology, results, and significance.
Paper Details
PDF Preview
Key Terms
Citation Network
Current paper (gray), citations (green), references (blue)
Display is limited for performance on very large graphs.
| Title | Authors | Year | Actions |
|---|
Comments (0)