Summary
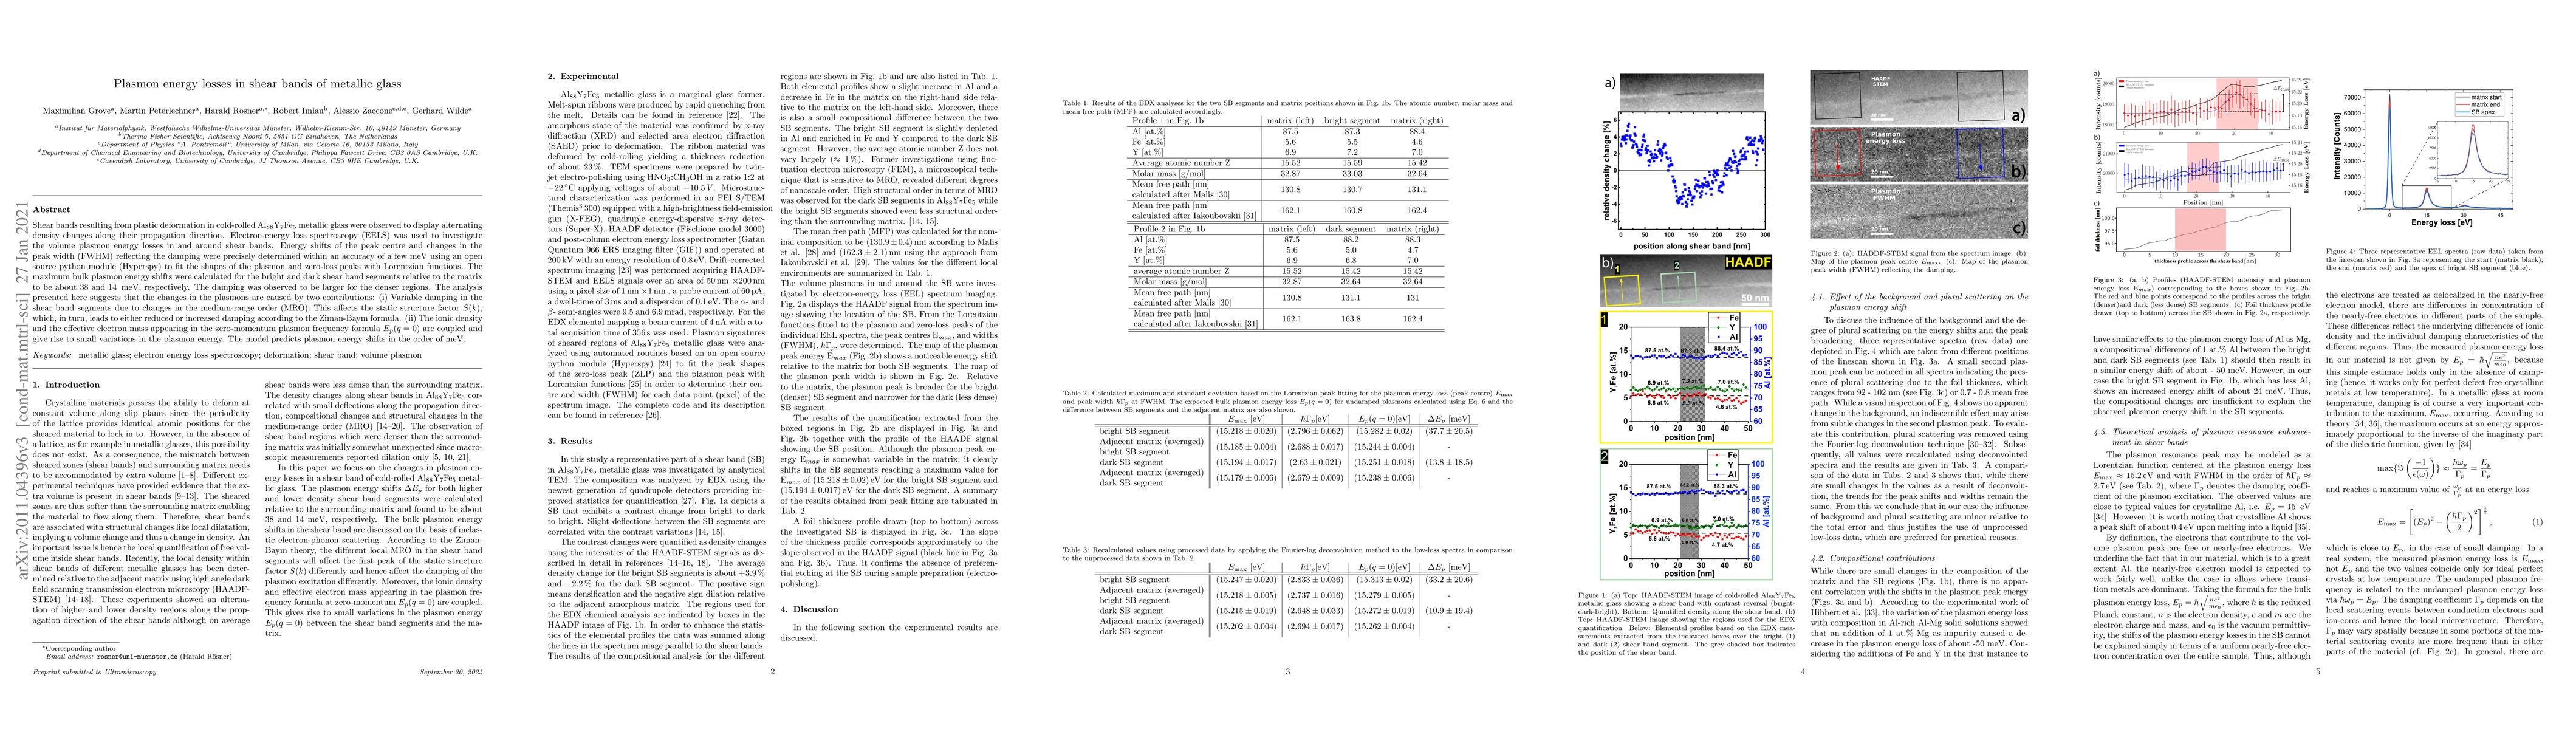
Shear bands resulting from plastic deformation in cold-rolled Al$_{88}$Y$_{7}$Fe$_{5}$ metallic glass were observed to display alternating density changes along their propagation direction. Electron-energy loss spectroscopy (EELS) was used to investigate the volume plasmon energy losses in and around shear bands. Energy shifts of the peak centre and changes in the peak width (FWHM) reflecting the damping were precisely determined within an accuracy of a few meV using an open source python module (Hyperspy) to fit the shapes of the plasmon and zero-loss peaks with Lorentzian functions. The maximum bulk plasmon energy shifts were calculated for the bright and dark shear band segments relative to the matrix to be about 38 and 14 meV, respectively. The damping was observed to be larger for the denser regions. The analysis presented here suggests that the changes in the plasmons are caused by two contributions: (i) Variable damping in the shear band segments due to changes in the medium-range order (MRO). This affects the static structure factor S(k), which, in turn, leads to either reduced or increased damping according to the Ziman-Baym formula. (ii) The ionic density and the effective electron mass appearing in the zero-momentum plasmon frequency formula $E_p(q=0)$ are coupled and give rise to small variations in the plasmon energy. The model predicts plasmon energy shifts in the order of meV.
AI Key Findings
Get AI-generated insights about this paper's methodology, results, and significance.
Paper Details
PDF Preview
Key Terms
Citation Network
Current paper (gray), citations (green), references (blue)
Display is limited for performance on very large graphs.
Similar Papers
Found 4 papers| Title | Authors | Year | Actions |
|---|
Comments (0)