Summary
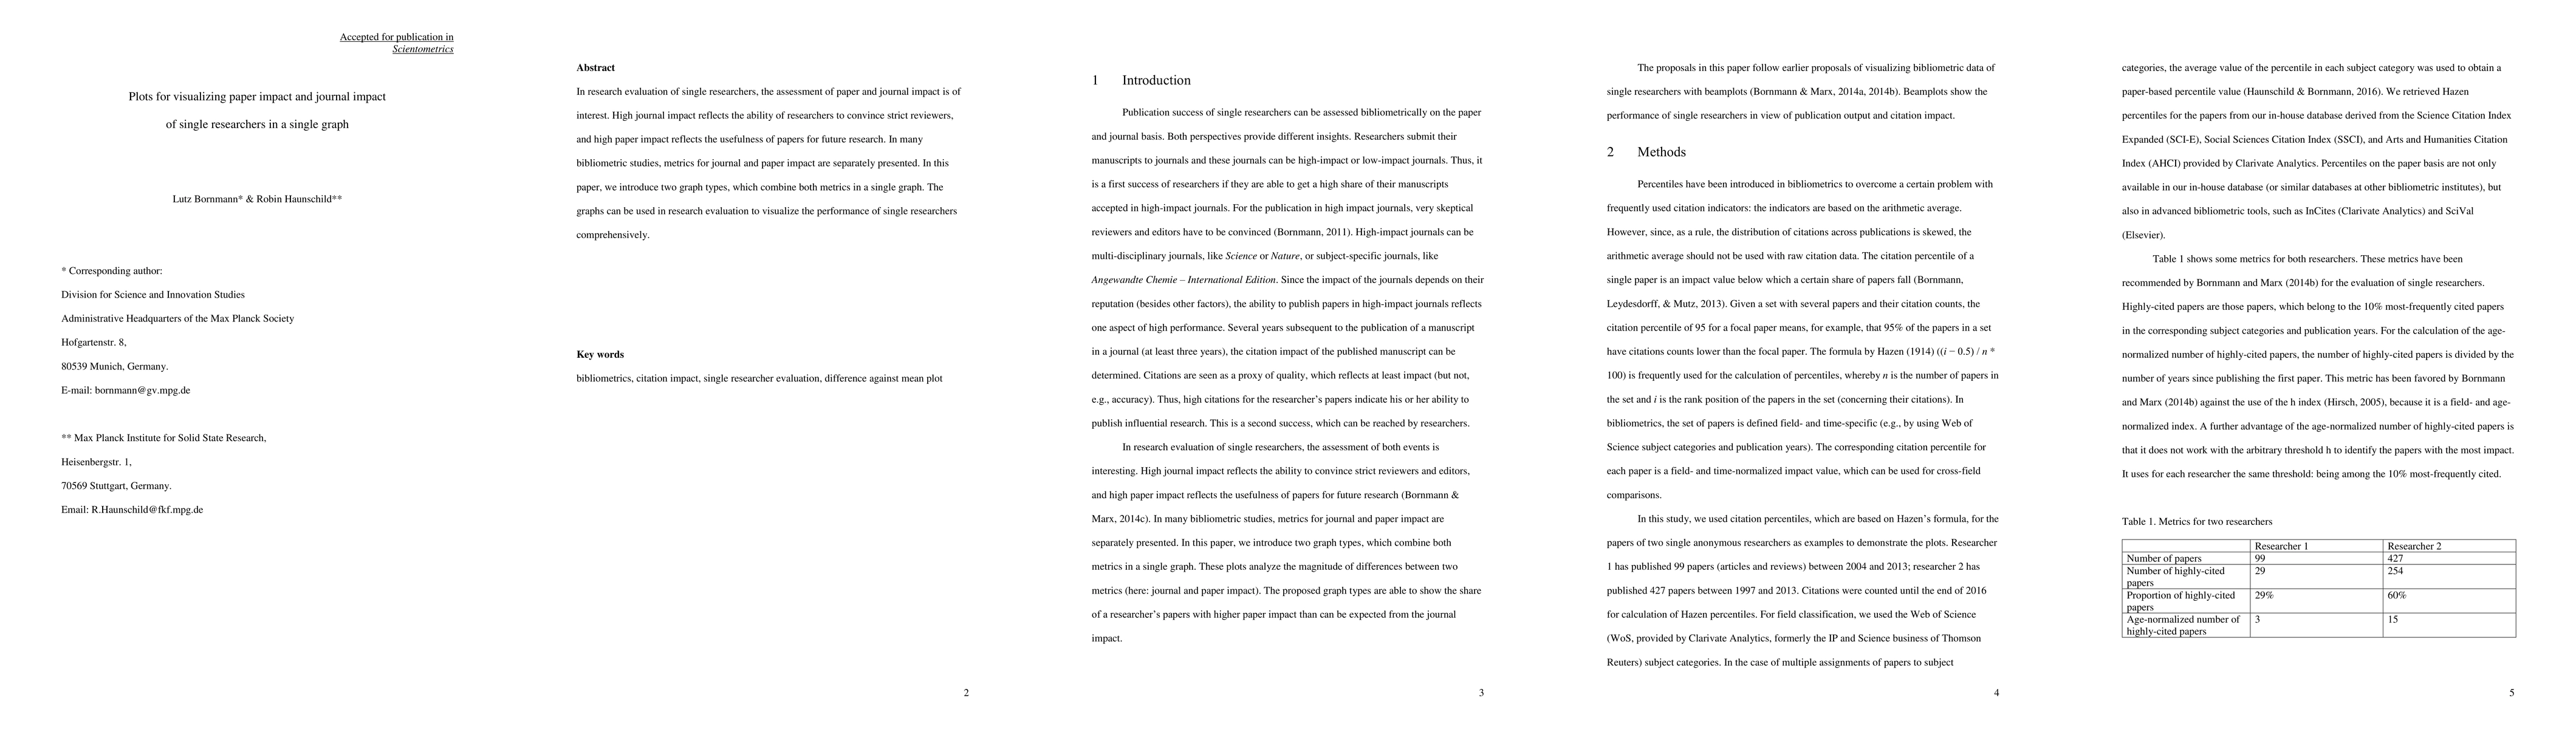
In research evaluation of single researchers, the assessment of paper and journal impact is of interest. High journal impact reflects the ability of researchers to convince strict reviewers, and high paper impact reflects the usefulness of papers for future research. In many bibliometric studies, metrics for journal and paper impact are separately presented. In this paper, we introduce two graph types, which combine both metrics in a single graph. The graphs can be used in research evaluation to visualize the performance of single researchers comprehensively.
AI Key Findings
Get AI-generated insights about this paper's methodology, results, and significance.
Paper Details
PDF Preview
Key Terms
Citation Network
Current paper (gray), citations (green), references (blue)
Display is limited for performance on very large graphs.
| Title | Authors | Year | Actions |
|---|
Comments (0)