Publication
Metrics
Paper Preview
Abstract
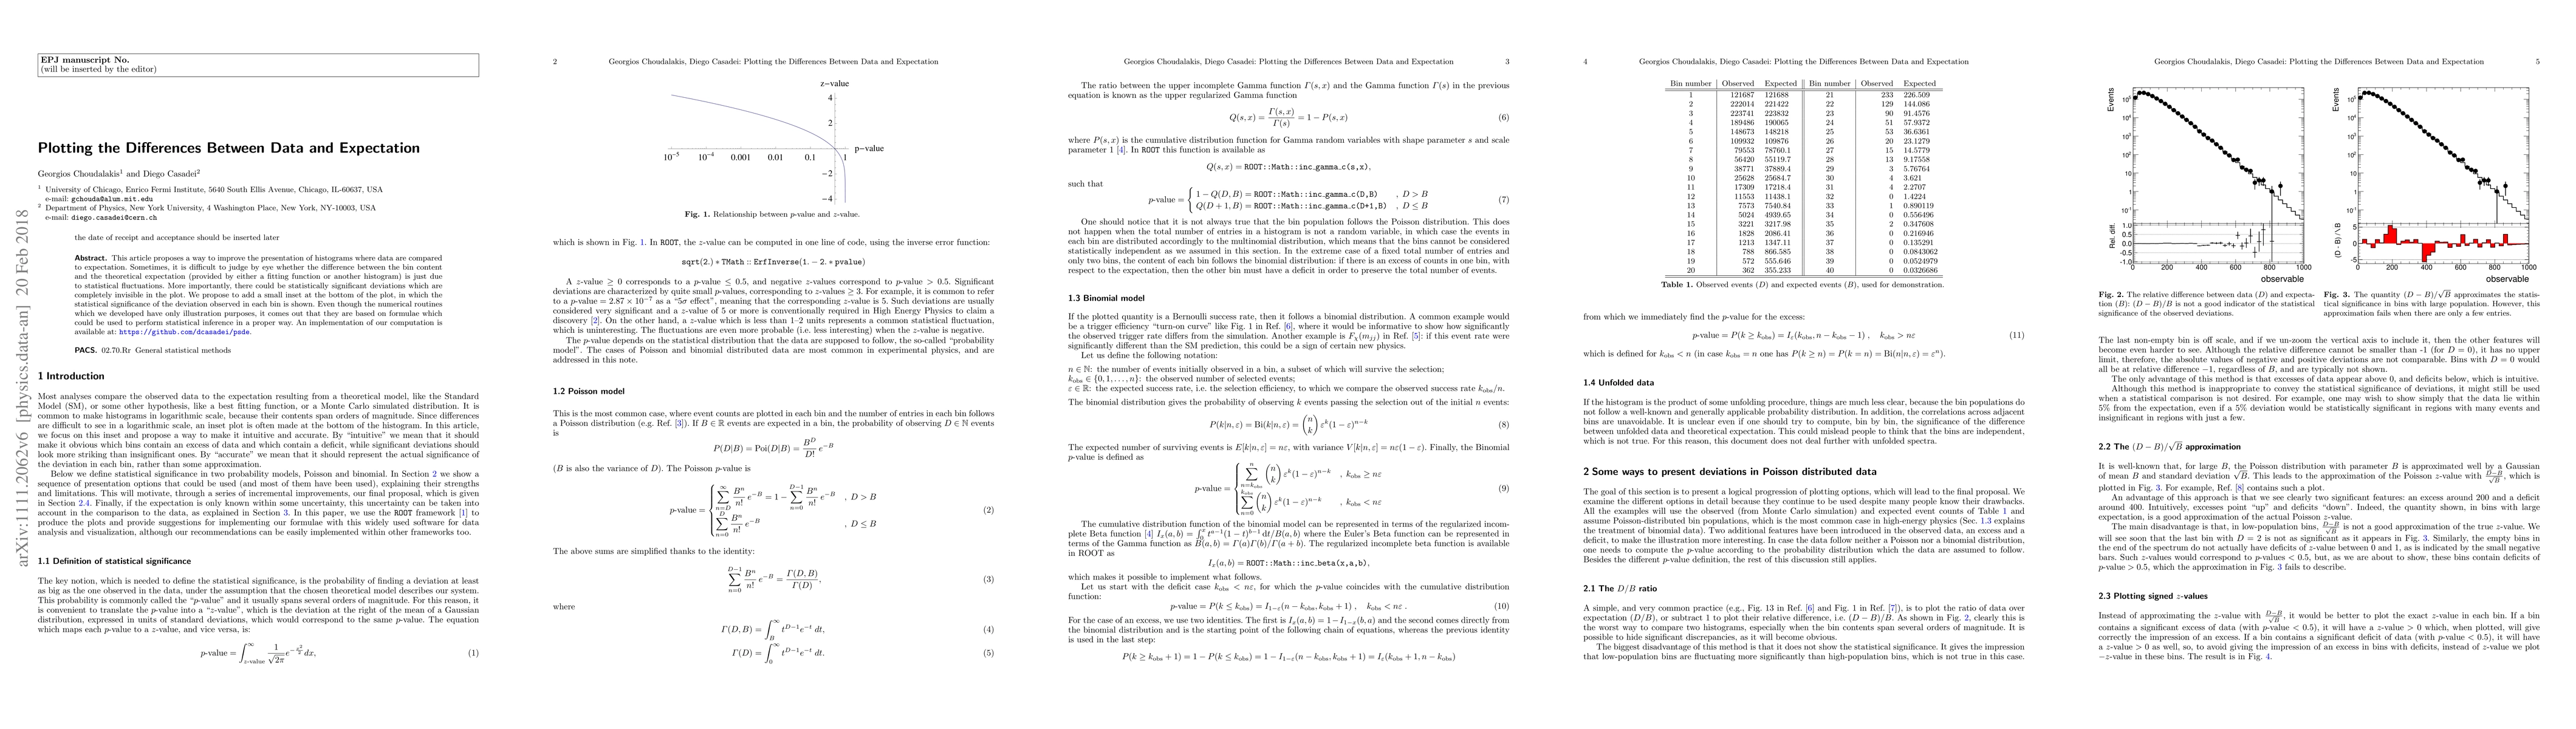
This article proposes a way to improve the presentation of histograms where data are compared to expectation. Sometimes, it is difficult to judge by eye whether the difference between the bin content and the theoretical expectation (provided by either a fitting function or another histogram) is just due to statistical fluctuations. More importantly, there could be statistically significant deviations which are completely invisible in the plot. We propose to add a small inset at the bottom of the plot, in which the statistical significance of the deviation observed in each bin is shown. Even though the numerical routines which we developed have only illustration purposes, it comes out that they are based on formulae which could be used to perform statistical inference in a proper way. An implementation of our computation is available at https://github.com/dcasadei/psde .
AI Key Findings
Get AI-generated insights about this paper's methodology, results, significance, and more — seven facets brought into focus.
Impact
Paper Details
PDF Preview
Key Terms
Citation Network
Current paper (gray), citations (green), references (blue)
Display is limited for performance on very large graphs.
Discussion 0