Summary
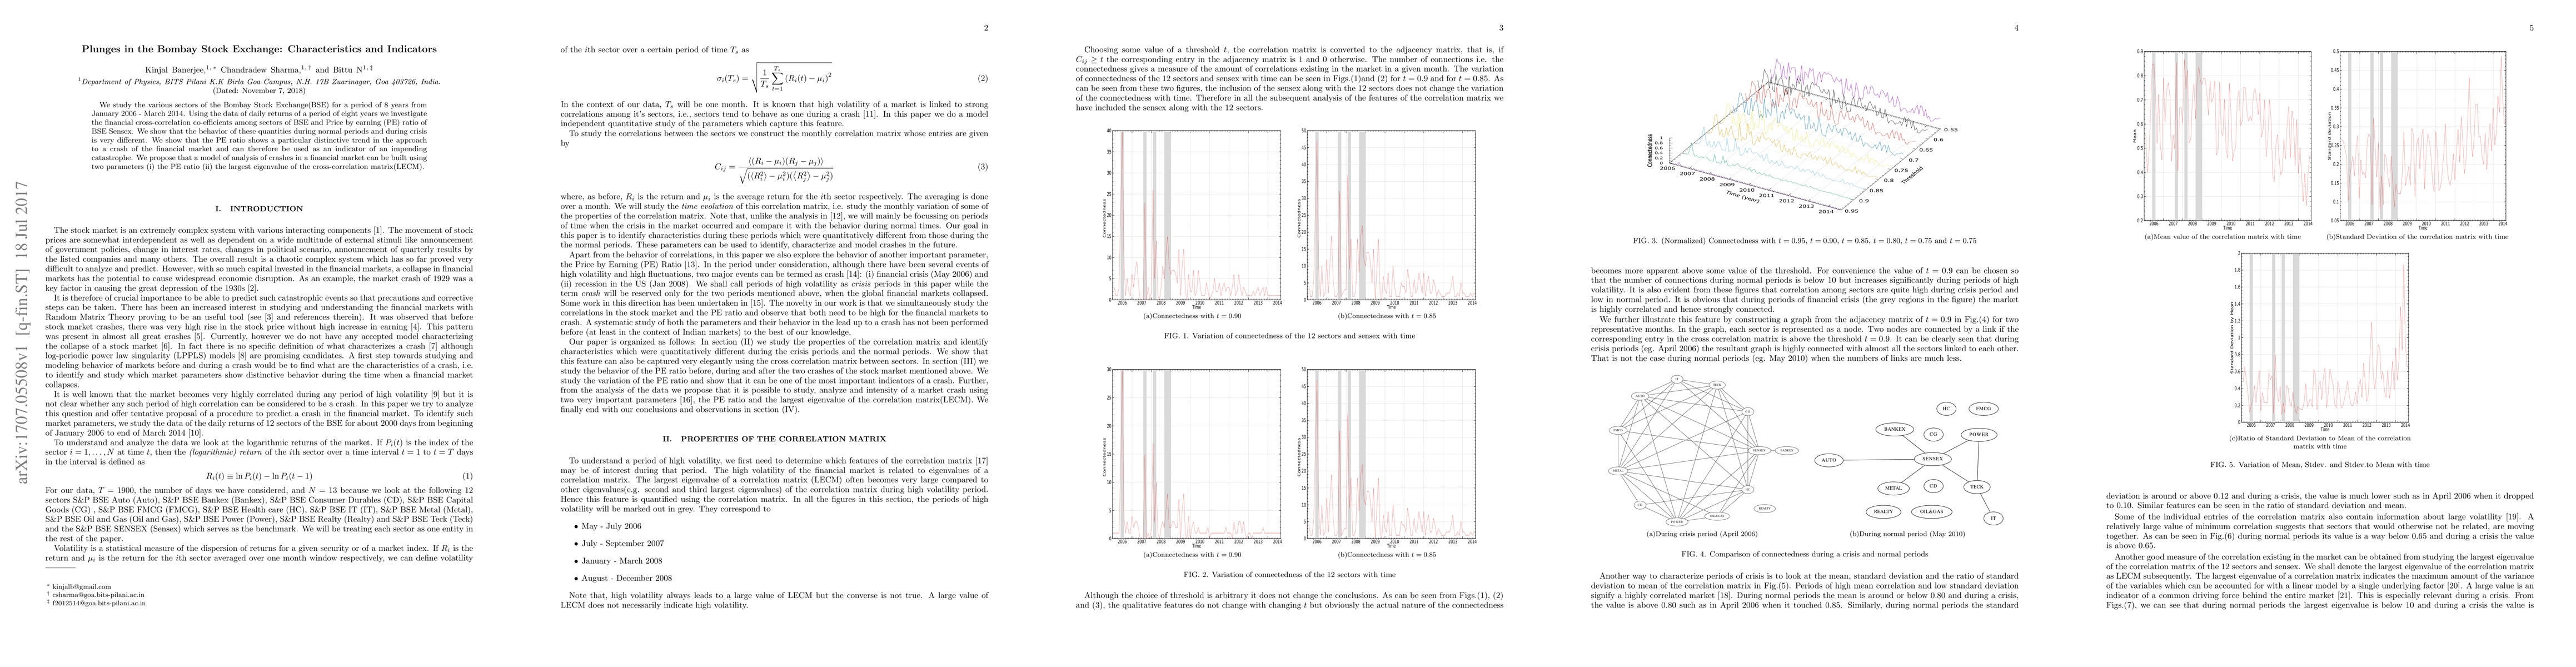
We study the various sectors of the Bombay Stock Exchange (BSE) for a period of eight years from January 2006 to March 2014. Using the data of the daily returns of a period of eight years we investigate the financial cross correlation co-efficients among the sectors of BSE and Price by Earning (PE) ratio of BSE Sensex. We show that the behavior of these quantities during normal periods and during crisis is very different. We show that the PE ratio shows a particular distinctive trend in the approach to a crash of the financial market and can therefore be used as an indicator of an impending catastrophe. We propose that a model of analysis of crashes in a financial market can be built using two parameters: (i) the PE ratio and (ii) the largest eigenvalue of the cross correlation matrix.
AI Key Findings
Get AI-generated insights about this paper's methodology, results, and significance.
Paper Details
PDF Preview
Key Terms
Citation Network
Current paper (gray), citations (green), references (blue)
Display is limited for performance on very large graphs.
Similar Papers
Found 4 papersFuzzy Expert System for Stock Portfolio Selection: An Application to Bombay Stock Exchange
Gour Sundar Mitra Thakur, Rupak Bhattacharyya, Seema Sarkar
A Study on Impact of Environmental Accounting on Profitability of Companies listed in Bombay Stock Exchange
Sudharani R, Suresh N, Nandini E. S
No citations found for this paper.
Comments (0)