Publication
Metrics
AI Quick Summary
This paper introduces a domain-specific language extension for scientific visualization that allows efficient computation and visualization of higher-order finite element method (FEM) data. The authors added mesh position types and arithmetic operations to an existing DSL, enabling existing regular grid visualization programs to work with unstructured FEM meshes with minimal changes.
Paper Preview
Abstract
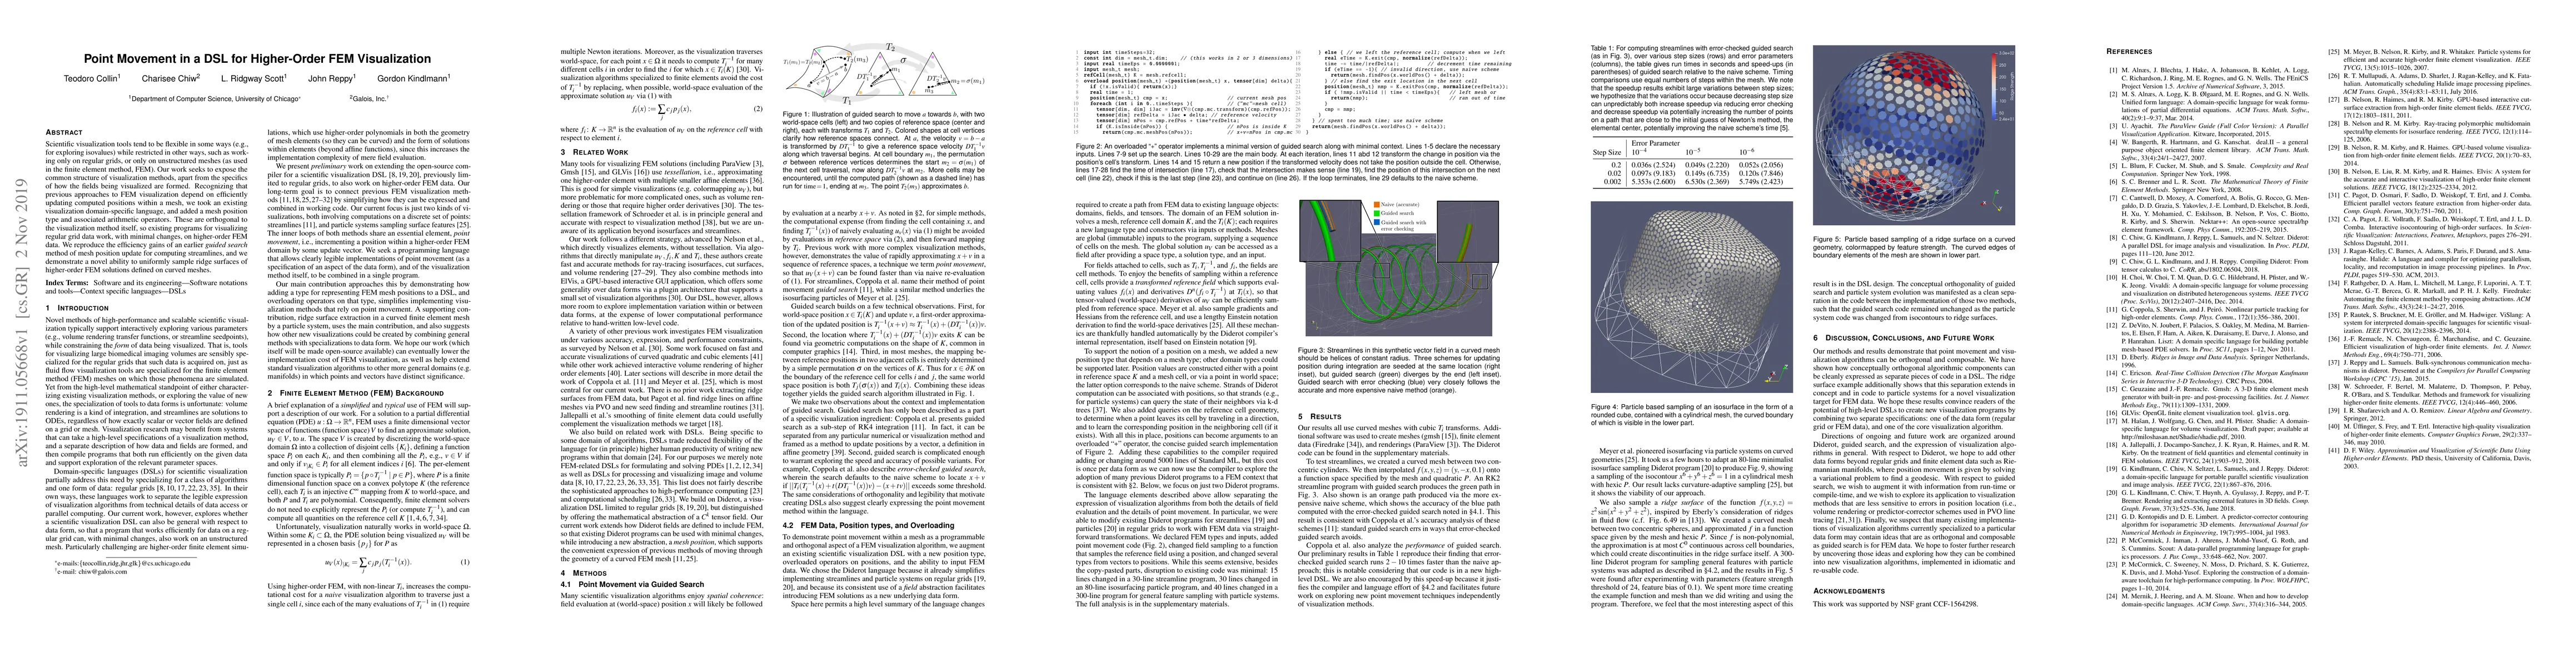
Scientific visualization tools tend to be flexible in some ways (e.g., for exploring isovalues) while restricted in other ways, such as working only on regular grids, or only on unstructured meshes (as used in the finite element method, FEM). Our work seeks to expose the common structure of visualization methods, apart from the specifics of how the fields being visualized are formed. Recognizing that previous approaches to FEM visualization depend on efficiently updating computed positions within a mesh, we took an existing visualization domain-specific language, and added a mesh position type and associated arithmetic operators. These are orthogonal to the visualization method itself, so existing programs for visualizing regular grid data work, with minimal changes, on higher-order FEM data. We reproduce the efficiency gains of an earlier guided search method of mesh position update for computing streamlines, and we demonstrate a novel ability to uniformly sample ridge surfaces of higher-order FEM solutions defined on curved meshes.
AI Key Findings
Get AI-generated insights about this paper's methodology, results, significance, and more — seven facets brought into focus.
Impact
Paper Details
Authors
PDF Preview
Key Terms
Citation Network
Current paper (gray), citations (green), references (blue)
Display is limited for performance on very large graphs.
Discussion 0