Summary
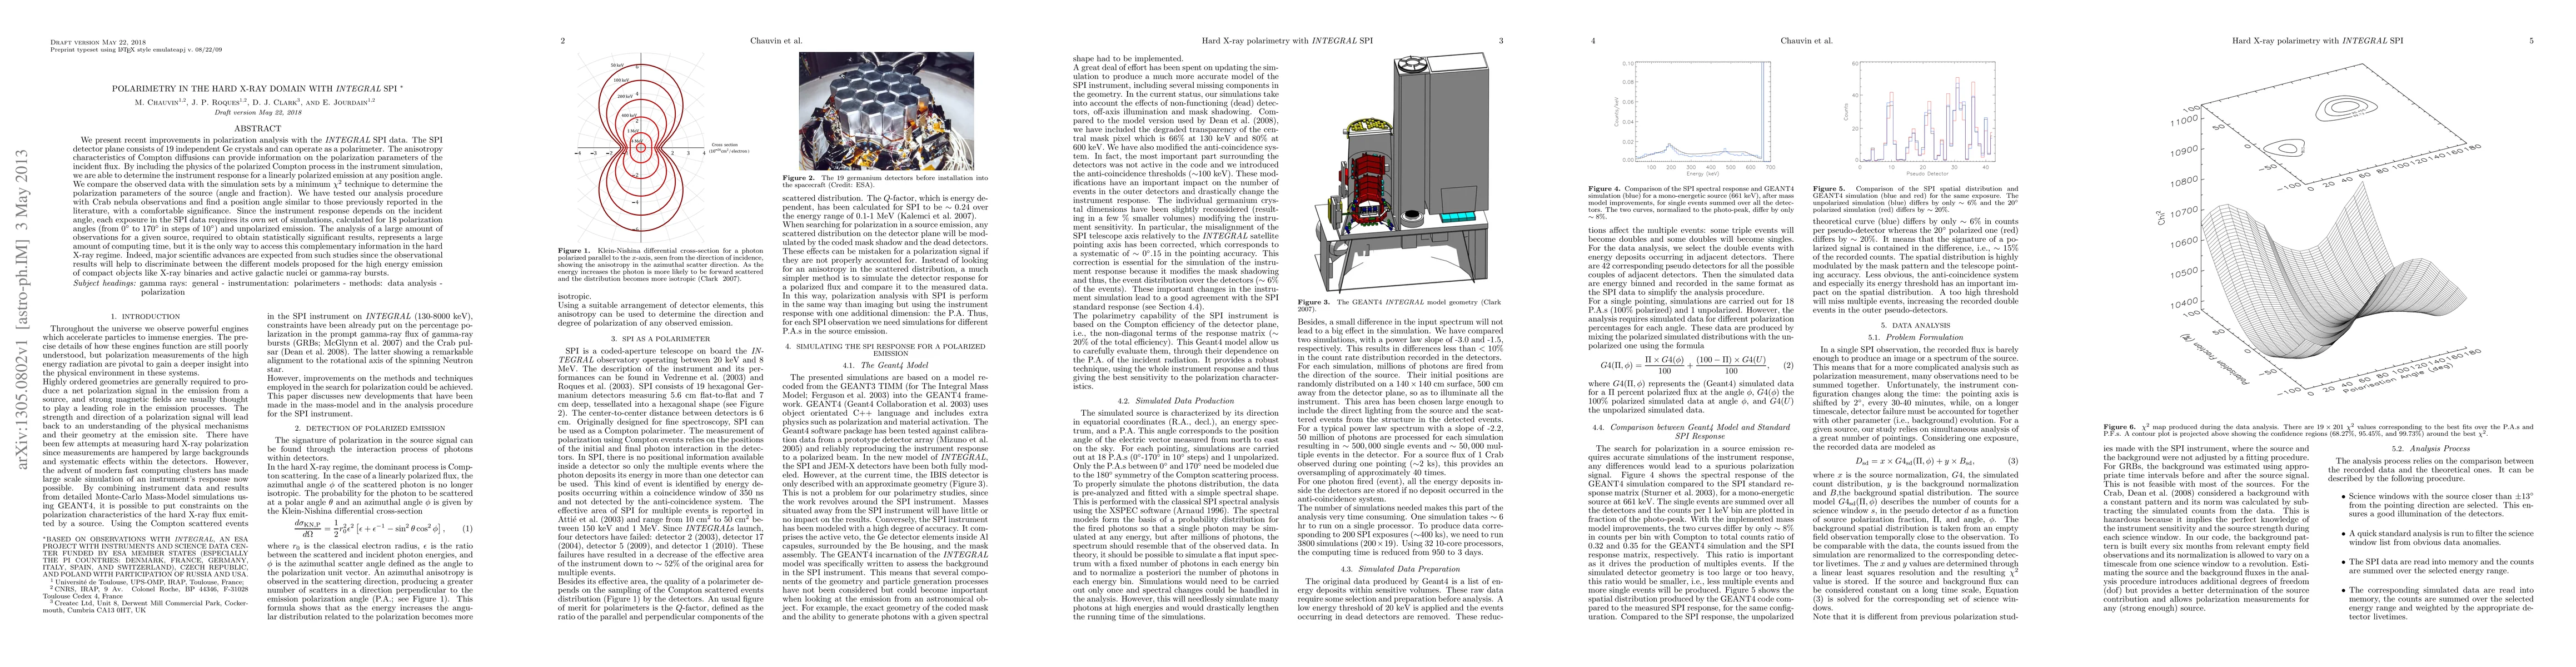
We present recent improvements in polarization analysis with the INTEGRAL SPI data. The SPI detector plane consists of 19 independent Ge crystals and can operate as a polarimeter. The anisotropy characteristics of Compton diffusions can provide information on the polarization parameters of the incident flux. By including the physics of the polarized Compton process in the instrument simulation, we are able to determine the instrument response for a linearly polarized emission at any position angle. We compare the observed data with the simulation sets by a minimum \chi^2 technique to determine the polarization parameters of the source (angle and fraction). We have tested our analysis procedure with Crab nebula observations and find a position angle similar to those previously reported in the literature, with a comfortable significance. Since the instrument response depends on the incident angle, each exposure in the SPI data requires its own set of simulations, calculated for 18 polarization angles (from 0{\deg} to 170{\deg} in steps of 10{\deg}) and unpolarized emission. The analysis of a large amount of observations for a given source, required to obtain statistically significant results, represents a large amount of computing time, but it is the only way to access this complementary information in the hard X-ray regime. Indeed, major scientific advances are expected from such studies since the observational results will help to discriminate between the different models proposed for the high energy emission of compact objects like X-ray binaries and active galactic nuclei or gamma-ray bursts.
AI Key Findings
Get AI-generated insights about this paper's methodology, results, and significance.
Paper Details
PDF Preview
Key Terms
Citation Network
Current paper (gray), citations (green), references (blue)
Display is limited for performance on very large graphs.
Similar Papers
Found 4 papers| Title | Authors | Year | Actions |
|---|
Comments (0)