POLYCHARTQA: Benchmarking Large Vision-Language Models with Multilingual Chart Question Answering
Publication
Metrics
Paper Preview
Abstract
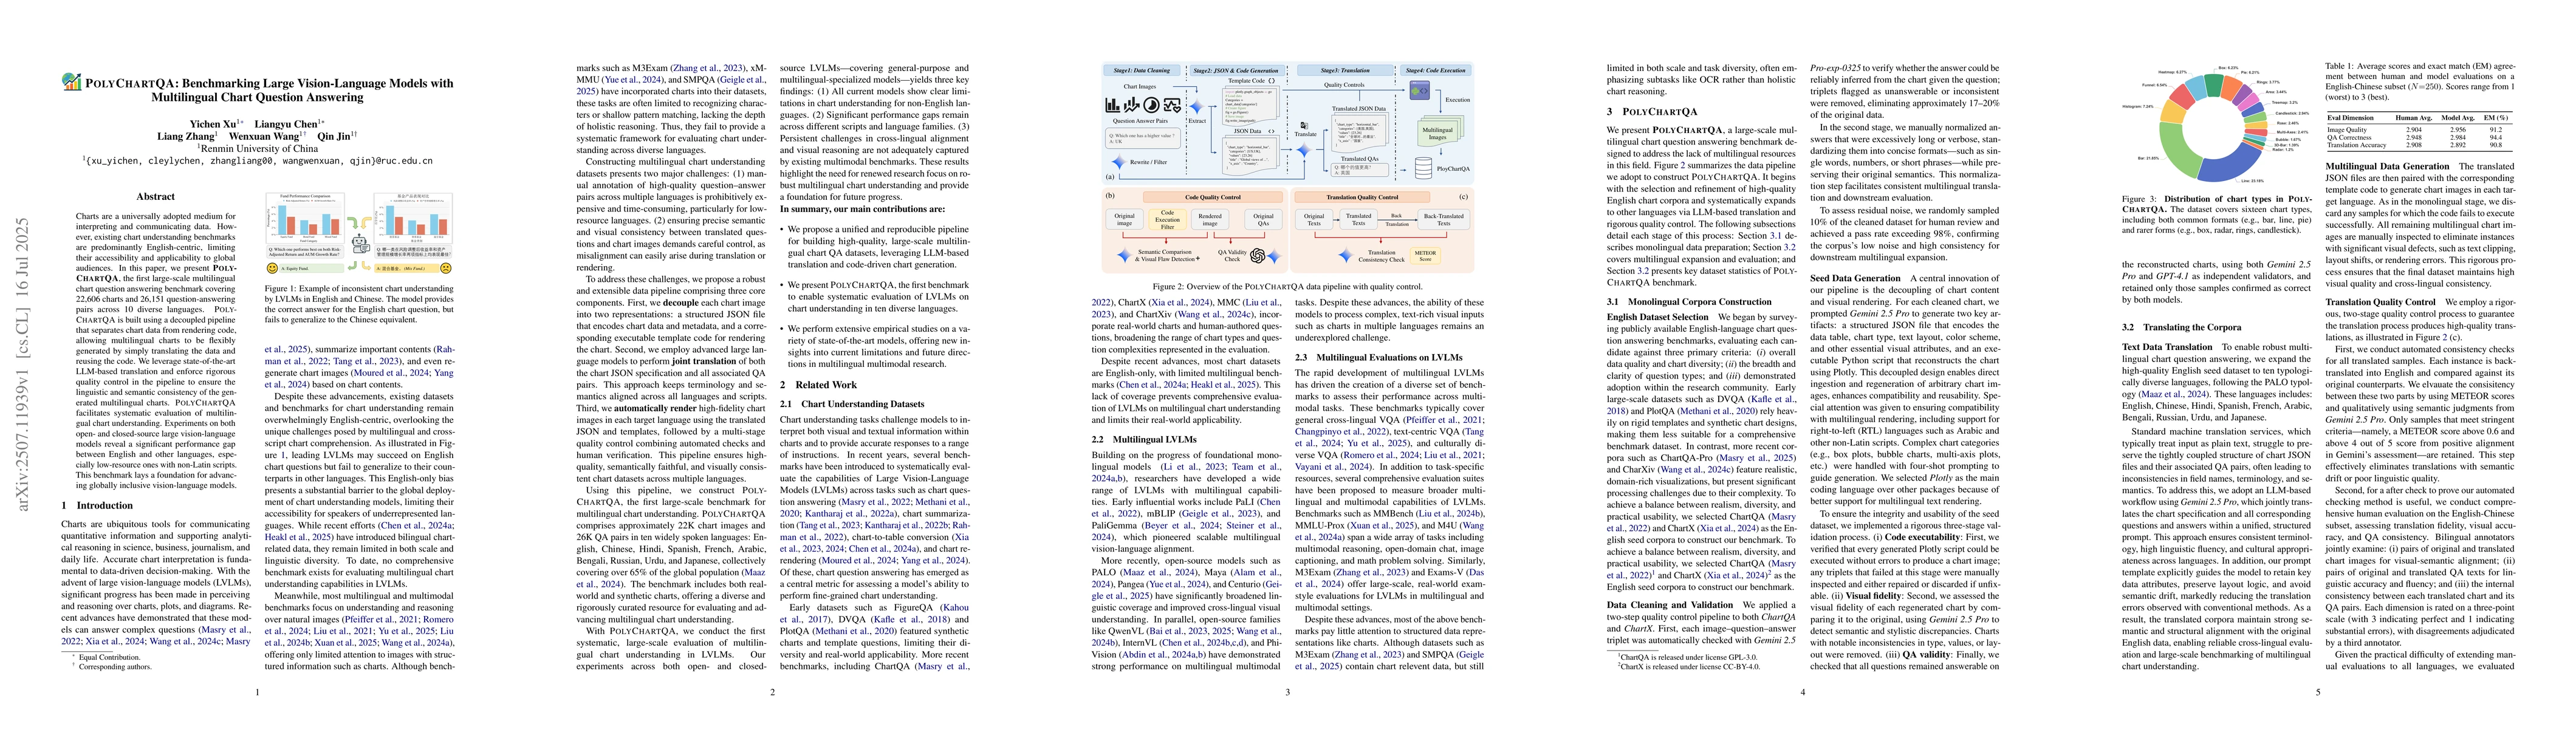
Charts are a universally adopted medium for interpreting and communicating data. However, existing chart understanding benchmarks are predominantly English-centric, limiting their accessibility and applicability to global audiences. In this paper, we present PolyChartQA, the first large-scale multilingual chart question answering benchmark covering 22,606 charts and 26,151 question-answering pairs across 10 diverse languages. PolyChartQA is built using a decoupled pipeline that separates chart data from rendering code, allowing multilingual charts to be flexibly generated by simply translating the data and reusing the code. We leverage state-of-the-art LLM-based translation and enforce rigorous quality control in the pipeline to ensure the linguistic and semantic consistency of the generated multilingual charts. PolyChartQA facilitates systematic evaluation of multilingual chart understanding. Experiments on both open- and closed-source large vision-language models reveal a significant performance gap between English and other languages, especially low-resource ones with non-Latin scripts. This benchmark lays a foundation for advancing globally inclusive vision-language models.
AI Key Findings
Get AI-generated insights about this paper's methodology, results, significance, and more — seven facets brought into focus.
Impact
Paper Details
Authors
PDF Preview
Citation Network
Current paper (gray), citations (green), references (blue)
Display is limited for performance on very large graphs.
Discussion 0