Population dynamics on random networks: simulations and analytical models
Publication
Metrics
AI Quick Summary
This paper explores the phase diagrams of two population dynamics models—SIS infection spread and predator-prey interaction—on networks with homogeneous degree $k$. It finds that both models exhibit oscillatory behavior for small $k$ but lose this phase when $k$ is large, highlighting the relevance of network structure in population dynamics.
Paper Preview
Abstract
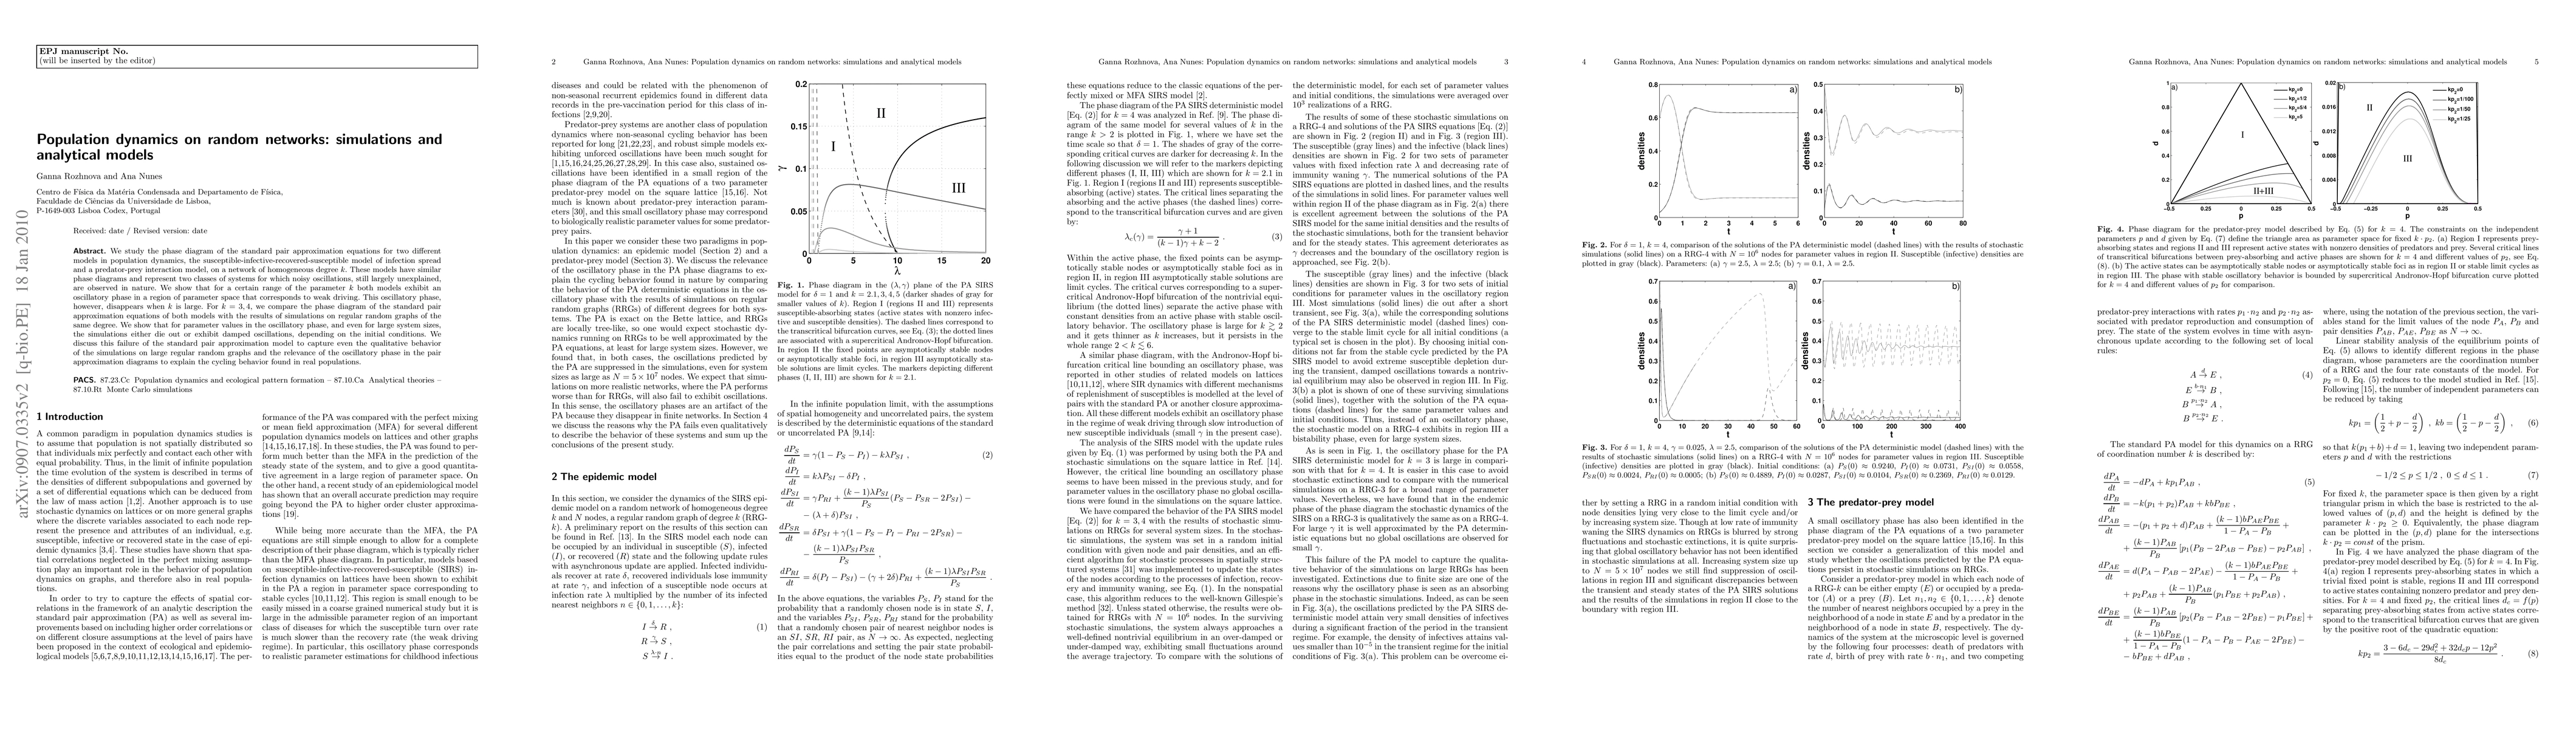
We study the phase diagram of the standard pair approximation equations for two different models in population dynamics, the susceptible-infective-recovered-susceptible model of infection spread and a predator-prey interaction model, on a network of homogeneous degree $k$. These models have similar phase diagrams and represent two classes of systems for which noisy oscillations, still largely unexplained, are observed in nature. We show that for a certain range of the parameter $k$ both models exhibit an oscillatory phase in a region of parameter space that corresponds to weak driving. This oscillatory phase, however, disappears when $k$ is large. For $k=3, 4$, we compare the phase diagram of the standard pair approximation equations of both models with the results of simulations on regular random graphs of the same degree. We show that for parameter values in the oscillatory phase, and even for large system sizes, the simulations either die out or exhibit damped oscillations, depending on the initial conditions. We discuss this failure of the standard pair approximation model to capture even the qualitative behavior of the simulations on large regular random graphs and the relevance of the oscillatory phase in the pair approximation diagrams to explain the cycling behavior found in real populations.
AI Key Findings
Get AI-generated insights about this paper's methodology, results, significance, and more — seven facets brought into focus.
Impact
Paper Details
PDF Preview
Key Terms
Citation Network
Current paper (gray), citations (green), references (blue)
Display is limited for performance on very large graphs.
Discussion 0