Population Power Curves in ASCA with Permutation Testing
Publication
Metrics
AI Quick Summary
This paper introduces Population Power Curves in ANOVA Simultaneous Component Analysis (ASCA) using permutation testing, distinguishing between Relative and Absolute Population Curves to optimize ASCA models and determine sample sizes in omics studies. Both curve types are demonstrated through simulations.
Paper Preview
Abstract
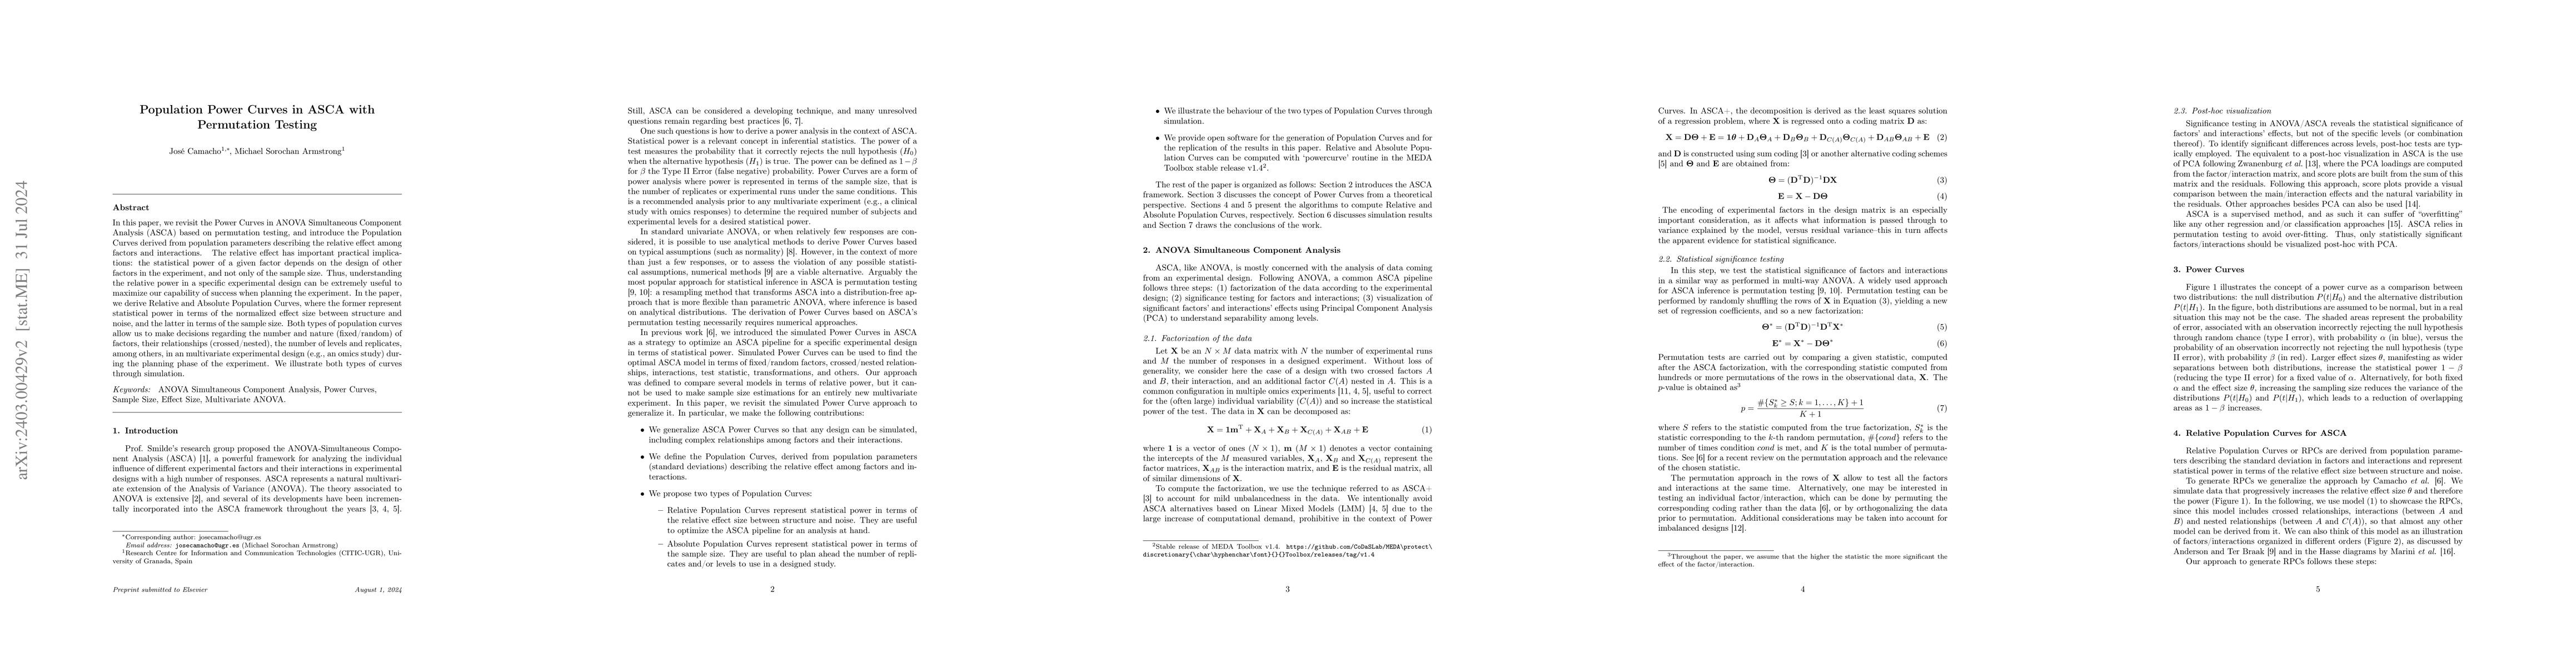
In this paper, we revisit the Power Curves in ANOVA Simultaneous Component Analysis (ASCA) based on permutation testing, and introduce the Population Curves derived from population parameters describing the relative effect among factors and interactions. We distinguish Relative from Absolute Population Curves, where the former represent statistical power in terms of the normalized effect size between structure and noise, and the latter in terms of the sample size. Relative Population Curves are useful to find the optimal ASCA model (e.g., fixed/random factors, crossed/nested relationships, interactions, the test statistic, transformations, etc.) for the analysis of an experimental design at hand. Absolute Population Curves are useful to determine the sample size and the optimal number of levels for each factor during the planning phase on an experiment. We illustrate both types of curves through simulation. We expect Population Curves to become the go-to approach to plan the optimal analysis pipeline and the required sample size in an omics study analyzed with ASCA.
AI Key Findings
Get AI-generated insights about this paper's methodology, results, significance, and more — seven facets brought into focus.
Impact
Paper Details
Authors
PDF Preview
Key Terms
Citation Network
Current paper (gray), citations (green), references (blue)
Display is limited for performance on very large graphs.
Discussion 0