Post Processing Graphical User Interface for Heat Flow Visualization
Publication
Metrics
Paper Preview
Abstract
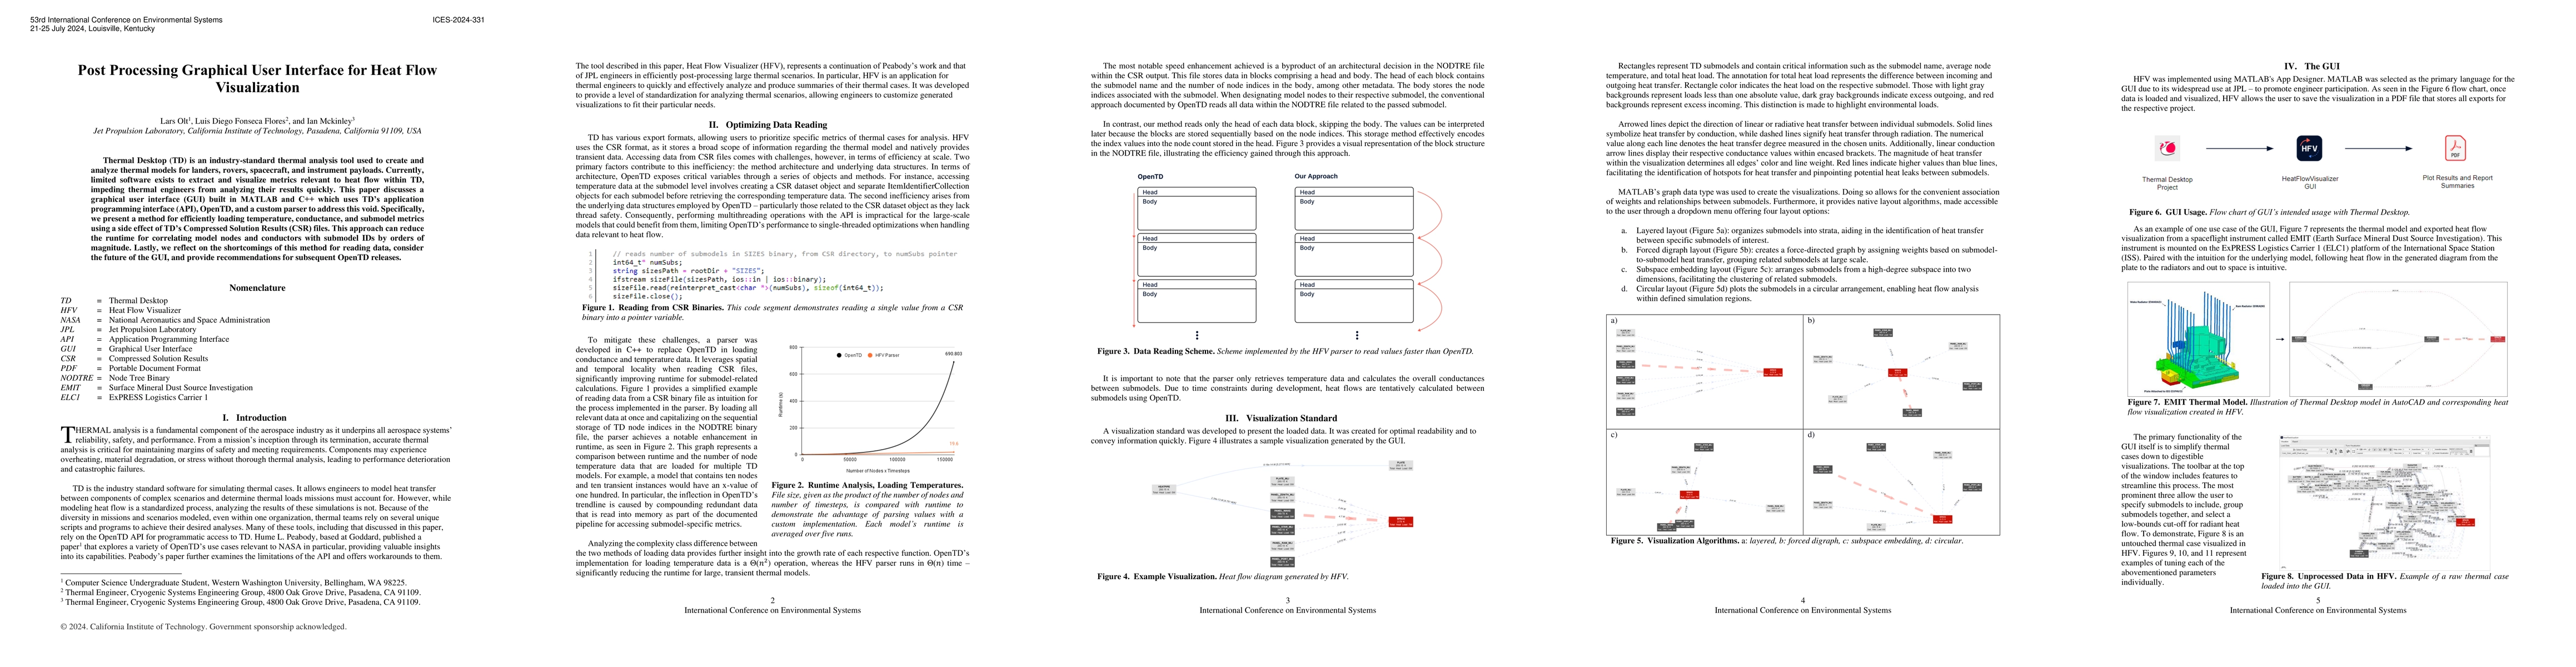
Thermal Desktop (TD) is an industry-standard thermal analysis tool used to create and analyze thermal models for landers, rovers, spacecraft, and instrument payloads. Currently, limited software exists to extract and visualize metrics relevant to heat flow within TD, impeding thermal engineers from analyzing their results quickly. This paper discusses a graphical user interface (GUI) built in MATLAB and C++ which uses TDs application programming interface (API), OpenTD, and a custom parser to address this void. Specifically, we present a method for efficiently loading temperature, conductance, and submodel metrics using a side effect of TDs Compressed Solution Results (CSR) files. This approach can reduce the runtime for correlating model nodes and conductors with submodel IDs by orders of magnitude. Lastly, we reflect on the shortcomings of this method for reading data, consider the future of the GUI, and provide recommendations for subsequent OpenTD releases.
AI Key Findings
Get AI-generated insights about this paper's methodology, results, significance, and more — seven facets brought into focus.
Discussion 0