Power and sample size calculation of two-sample projection-based testing for sparsely observed functional data
Publication
Metrics
AI Quick Summary
This paper develops a power and sample size calculation toolkit for projection-based testing of mean trajectory differences in sparsely observed functional data, demonstrating its robustness through simulations and application to Parkinson's disease trials. An accompanying R package, fPASS, is provided to facilitate practical implementation.
Paper Preview
Abstract
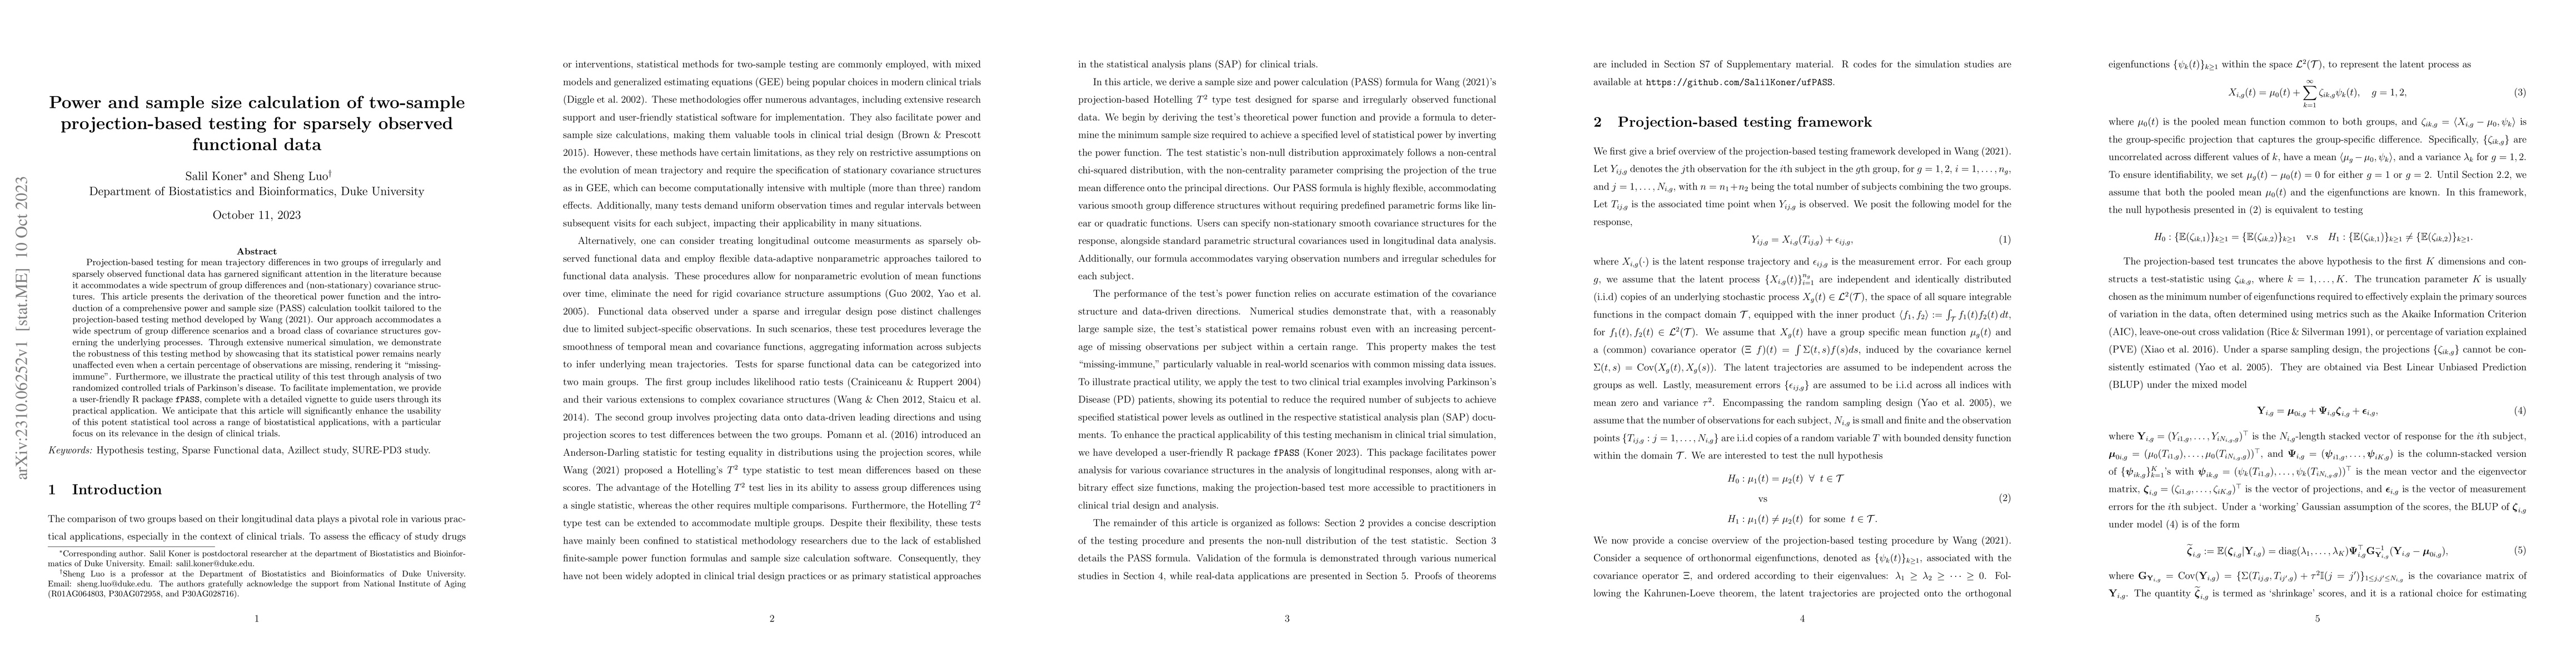
Projection-based testing for mean trajectory differences in two groups of irregularly and sparsely observed functional data has garnered significant attention in the literature because it accommodates a wide spectrum of group differences and (non-stationary) covariance structures. This article presents the derivation of the theoretical power function and the introduction of a comprehensive power and sample size (PASS) calculation toolkit tailored to the projection-based testing method developed by Wang (2021). Our approach accommodates a wide spectrum of group difference scenarios and a broad class of covariance structures governing the underlying processes. Through extensive numerical simulation, we demonstrate the robustness of this testing method by showcasing that its statistical power remains nearly unaffected even when a certain percentage of observations are missing, rendering it 'missing-immune'. Furthermore, we illustrate the practical utility of this test through analysis of two randomized controlled trials of Parkinson's disease. To facilitate implementation, we provide a user-friendly R package fPASS, complete with a detailed vignette to guide users through its practical application. We anticipate that this article will significantly enhance the usability of this potent statistical tool across a range of biostatistical applications, with a particular focus on its relevance in the design of clinical trials.
AI Key Findings
Get AI-generated insights about this paper's methodology, results, significance, and more — seven facets brought into focus.
Impact
Paper Details
Authors
PDF Preview
Key Terms
Citation Network
Current paper (gray), citations (green), references (blue)
Display is limited for performance on very large graphs.
Discussion 0