Powerful A/B-Testing Metrics and Where to Find Them
Publication
Metrics
AI Quick Summary
This paper explores the utility of various metrics in A/B-testing for recommender systems, proposing a method to quantify errors and statistical power to assess which metrics best support decision-making. Insights from large-scale experiments at ShareChat and Moj identify metrics with high statistical power.
Paper Preview
Abstract
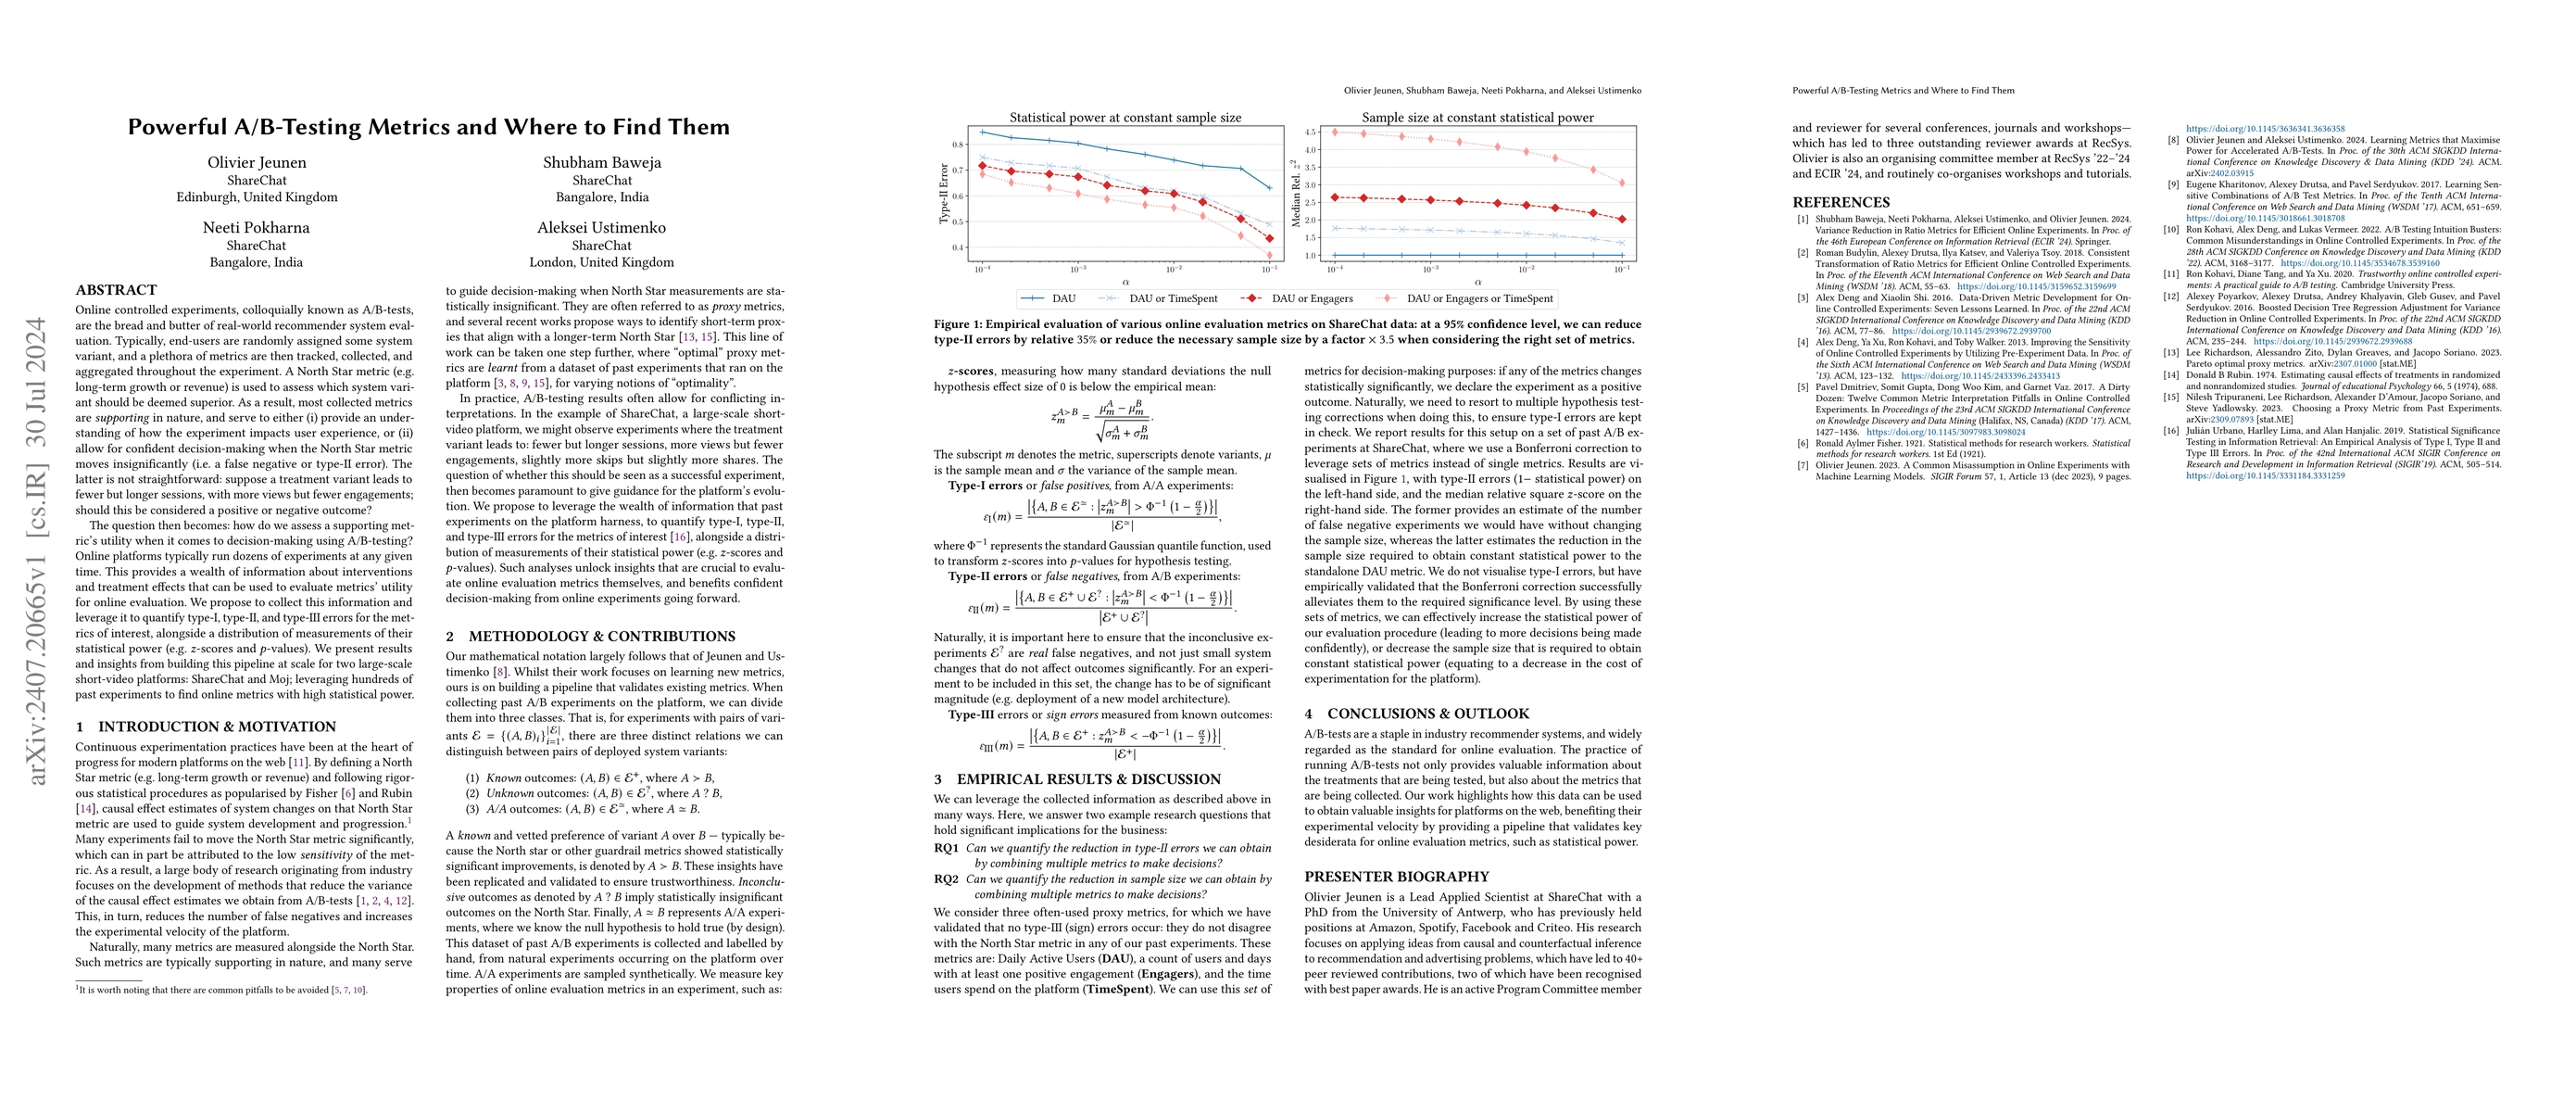
Online controlled experiments, colloquially known as A/B-tests, are the bread and butter of real-world recommender system evaluation. Typically, end-users are randomly assigned some system variant, and a plethora of metrics are then tracked, collected, and aggregated throughout the experiment. A North Star metric (e.g. long-term growth or revenue) is used to assess which system variant should be deemed superior. As a result, most collected metrics are supporting in nature, and serve to either (i) provide an understanding of how the experiment impacts user experience, or (ii) allow for confident decision-making when the North Star metric moves insignificantly (i.e. a false negative or type-II error). The latter is not straightforward: suppose a treatment variant leads to fewer but longer sessions, with more views but fewer engagements; should this be considered a positive or negative outcome? The question then becomes: how do we assess a supporting metric's utility when it comes to decision-making using A/B-testing? Online platforms typically run dozens of experiments at any given time. This provides a wealth of information about interventions and treatment effects that can be used to evaluate metrics' utility for online evaluation. We propose to collect this information and leverage it to quantify type-I, type-II, and type-III errors for the metrics of interest, alongside a distribution of measurements of their statistical power (e.g. $z$-scores and $p$-values). We present results and insights from building this pipeline at scale for two large-scale short-video platforms: ShareChat and Moj; leveraging hundreds of past experiments to find online metrics with high statistical power.
AI Key Findings
Get AI-generated insights about this paper's methodology, results, significance, and more — seven facets brought into focus.
Impact
Paper Details
Authors
PDF Preview
Citation Network
Current paper (gray), citations (green), references (blue)
Display is limited for performance on very large graphs.
Discussion 0