Publication
Metrics
AI Quick Summary
This paper offers practical guidelines for specifying a super learner (SL) algorithm in predictive modeling, emphasizing the importance of making key choices to tailor the SL to specific prediction tasks in epidemiology. It provides a flowchart summarizing heuristics and suggestions based on accumulated experience and theory to ensure optimal SL performance.
Paper Preview
Abstract
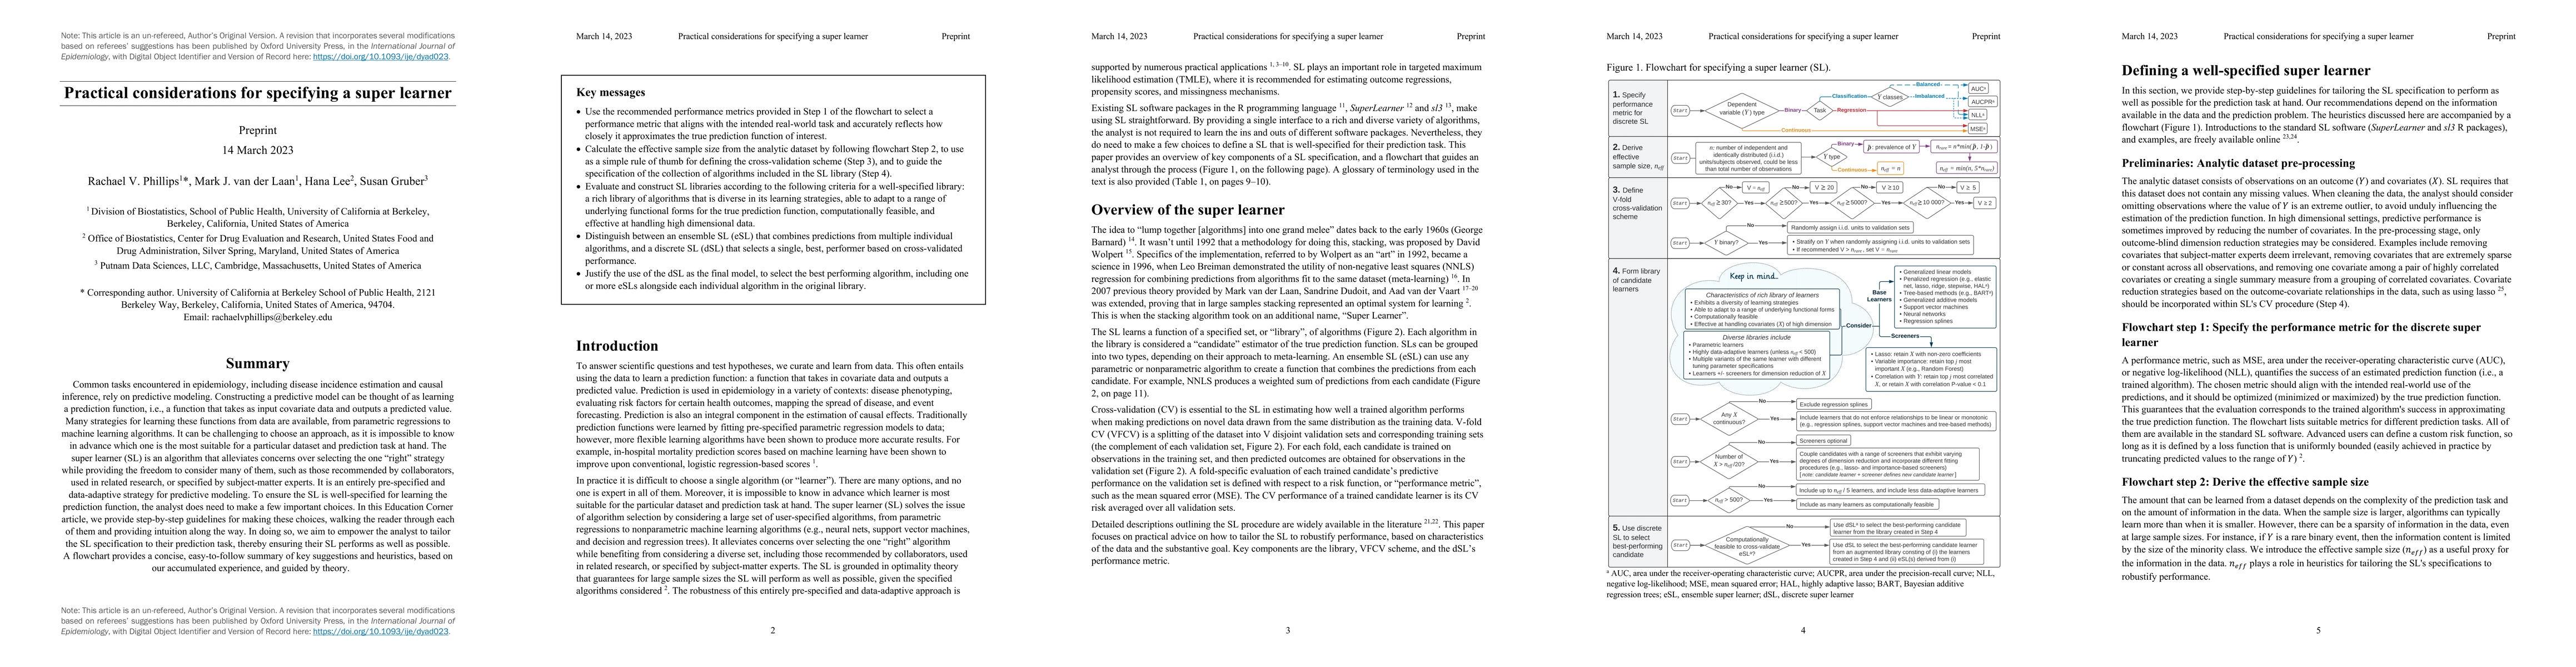
Common tasks encountered in epidemiology, including disease incidence estimation and causal inference, rely on predictive modeling. Constructing a predictive model can be thought of as learning a prediction function, i.e., a function that takes as input covariate data and outputs a predicted value. Many strategies for learning these functions from data are available, from parametric regressions to machine learning algorithms. It can be challenging to choose an approach, as it is impossible to know in advance which one is the most suitable for a particular dataset and prediction task at hand. The super learner (SL) is an algorithm that alleviates concerns over selecting the one "right" strategy while providing the freedom to consider many of them, such as those recommended by collaborators, used in related research, or specified by subject-matter experts. It is an entirely pre-specified and data-adaptive strategy for predictive modeling. To ensure the SL is well-specified for learning the prediction function, the analyst does need to make a few important choices. In this Education Corner article, we provide step-by-step guidelines for making these choices, walking the reader through each of them and providing intuition along the way. In doing so, we aim to empower the analyst to tailor the SL specification to their prediction task, thereby ensuring their SL performs as well as possible. A flowchart provides a concise, easy-to-follow summary of key suggestions and heuristics, based on our accumulated experience, and guided by theory.
AI Key Findings
Get AI-generated insights about this paper's methodology, results, significance, and more — seven facets brought into focus.
Impact
Paper Details
Authors
PDF Preview
Key Terms
Citation Network
Current paper (gray), citations (green), references (blue)
Display is limited for performance on very large graphs.
Discussion 0