Publication
Metrics
AI Quick Summary
This study uses Sloan Digital Sky Survey data to map the Sagittarius stream, identifying new debris and determining its maximal extent at 47.8 kpc (leading tail) and 102.5 kpc (trailing tail). The stream's orbital precession is noted to differ from logarithmic halo models, suggesting a Milky Way with steeper dark matter density falloff. The research also associates the globular cluster NGC 2419 with the trailing stream and observes distinct evolution patterns in the stream's tails, unexplained by current Sgr disruption simulations.
Paper Preview
Abstract
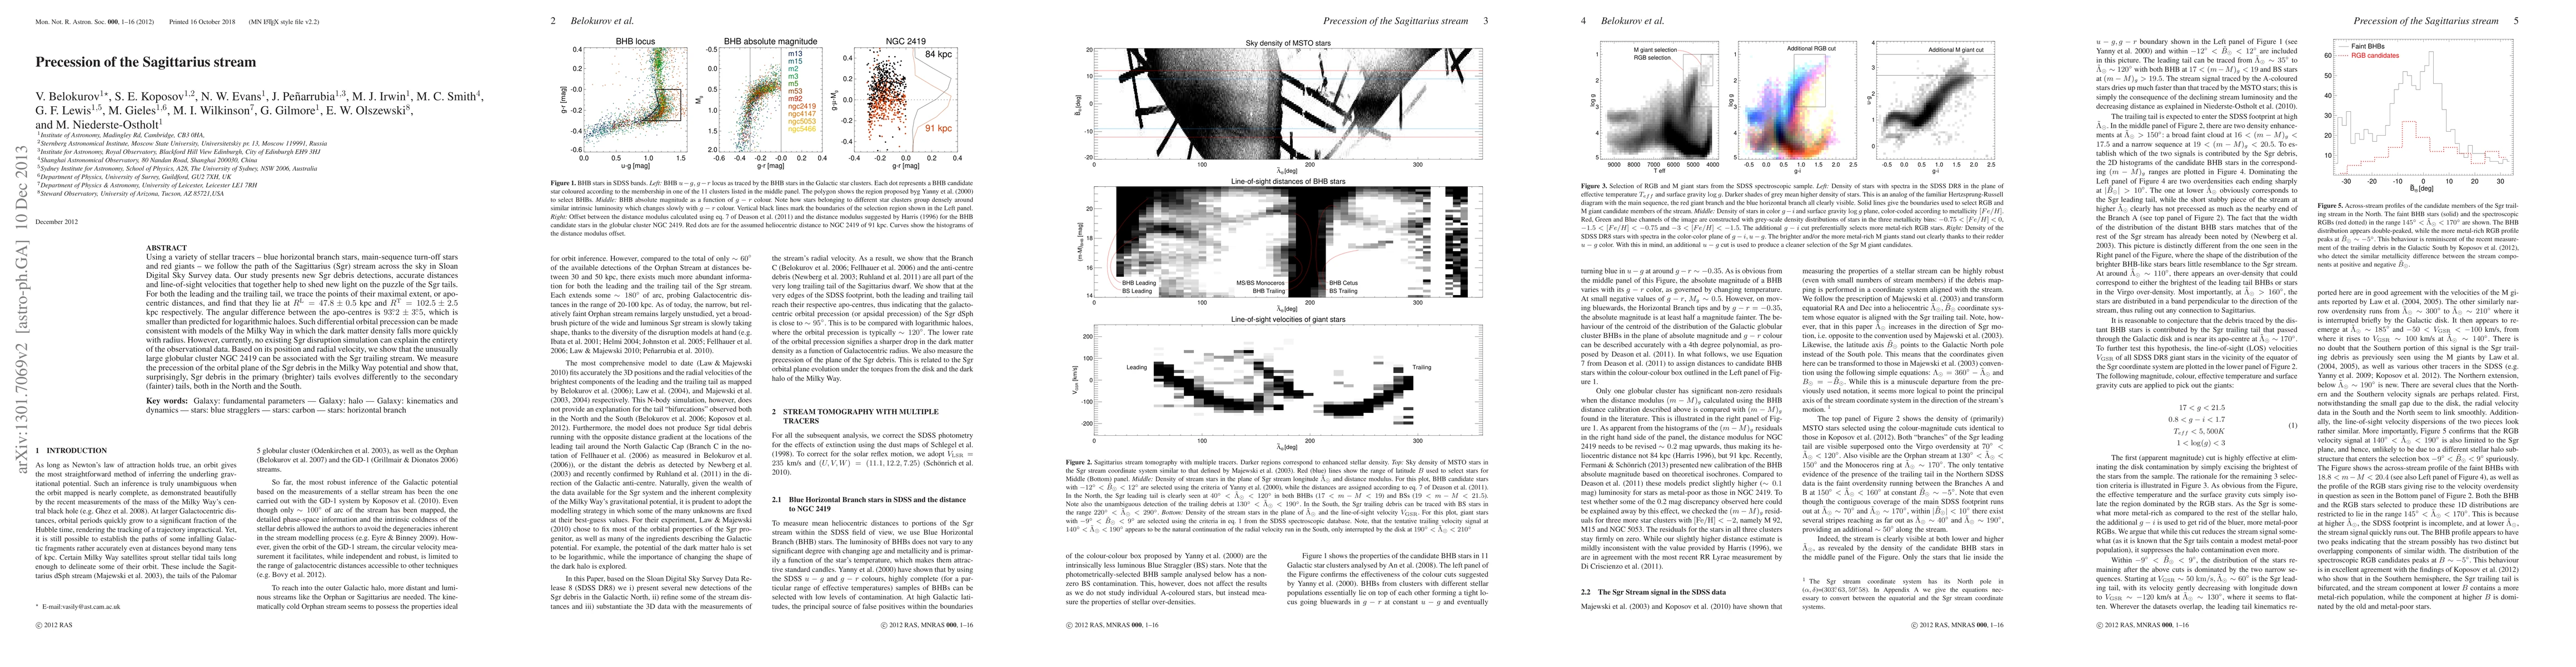
Using a variety of stellar tracers -- blue horizontal branch stars, main-sequence turn-off stars and red giants -- we follow the path of the Sagittarius (Sgr) stream across the sky in Sloan Digital Sky Survey data. Our study presents new Sgr debris detections, accurate distances and line-of-sight velocities that together help to shed new light on the puzzle of the Sgr tails. For both the leading and the trailing tail, we trace the points of their maximal extent, or apo-centric distances, and find that they lie at $R^L$ = 47.8 $\pm$ 0.5 kpc and $R^T$ = 102.5 $\pm$ 2.5 kpc respectively. The angular difference between the apo-centres is 93.2 $\pm$ 3.5 deg, which is smaller than predicted for logarithmic haloes. Such differential orbital precession can be made consistent with models of the Milky Way in which the dark matter density falls more quickly with radius. However, currently, no existing Sgr disruption simulation can explain the entirety of the observational data. Based on its position and radial velocity, we show that the unusually large globular cluster NGC 2419 can be associated with the Sgr trailing stream. We measure the precession of the orbital plane of the Sgr debris in the Milky Way potential and show that, surprisingly, Sgr debris in the primary (brighter) tails evolves differently to the secondary (fainter) tails, both in the North and the South.
AI Key Findings
Get AI-generated insights about this paper's methodology, results, significance, and more — seven facets brought into focus.
Impact
Paper Details
PDF Preview
Key Terms
Citation Network
Current paper (gray), citations (green), references (blue)
Display is limited for performance on very large graphs.
Discussion 0