Summary
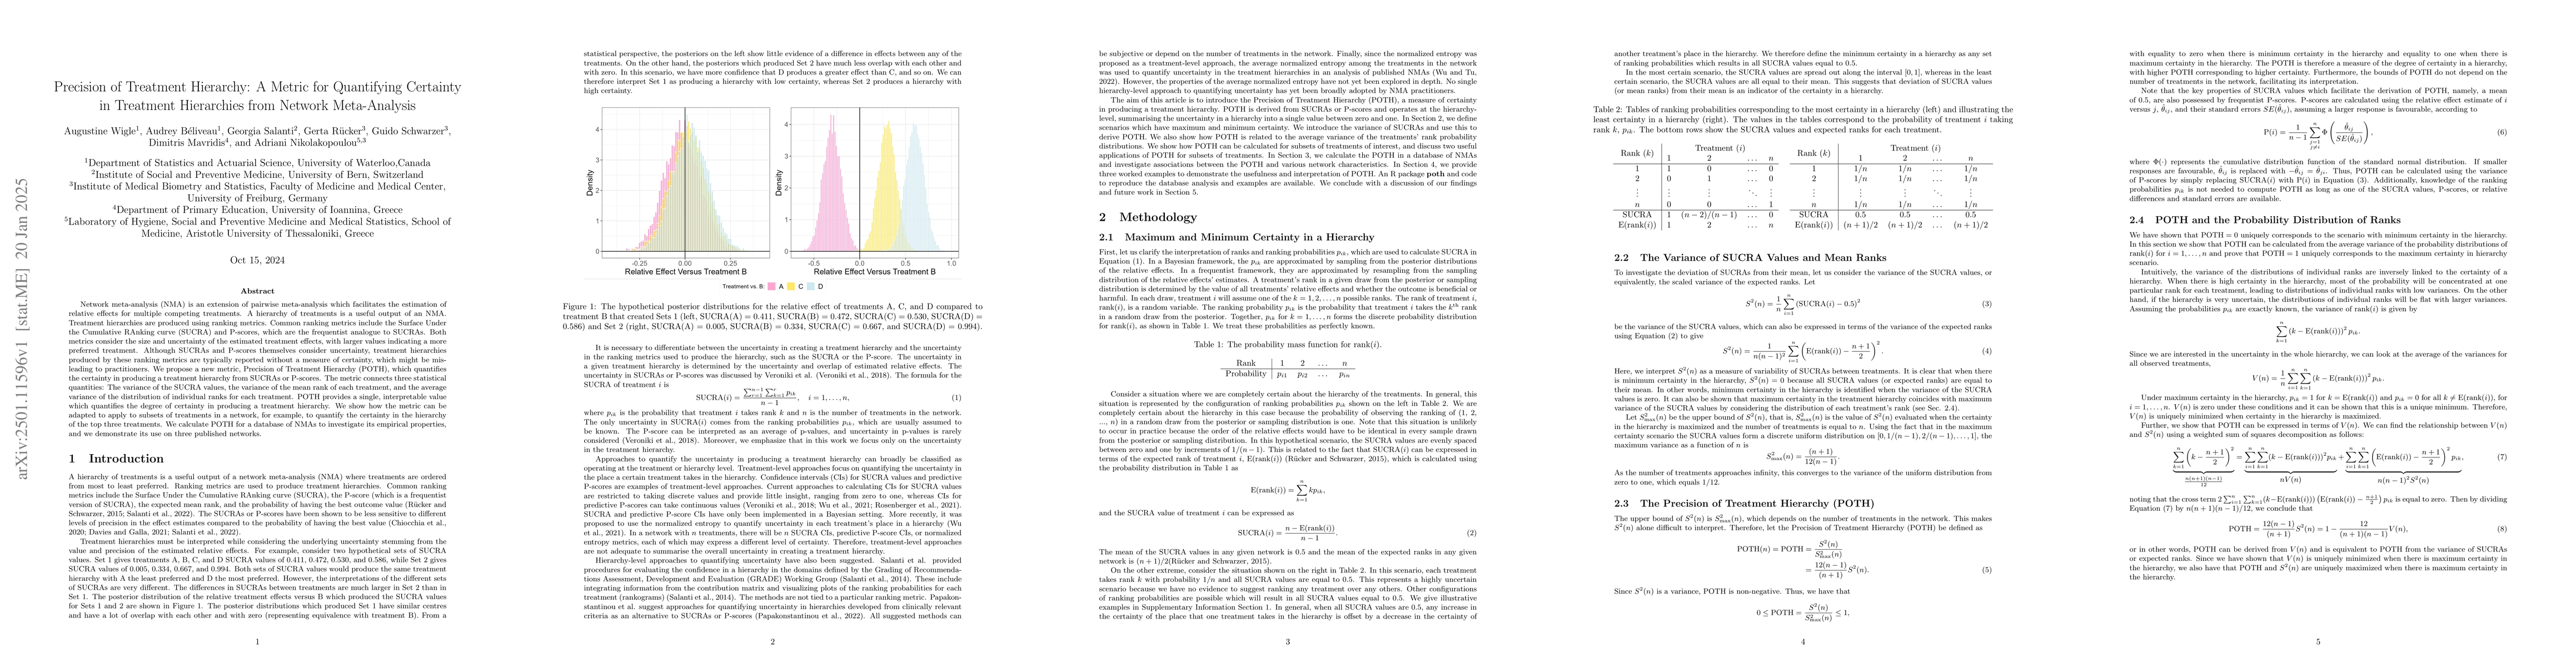
Network meta-analysis (NMA) is an extension of pairwise meta-analysis which facilitates the estimation of relative effects for multiple competing treatments. A hierarchy of treatments is a useful output of an NMA. Treatment hierarchies are produced using ranking metrics. Common ranking metrics include the Surface Under the Cumulative RAnking curve (SUCRA) and P-scores, which are the frequentist analogue to SUCRAs. Both metrics consider the size and uncertainty of the estimated treatment effects, with larger values indicating a more preferred treatment. Although SUCRAs and P-scores themselves consider uncertainty, treatment hierarchies produced by these ranking metrics are typically reported without a measure of certainty, which might be misleading to practitioners. We propose a new metric, Precision of Treatment Hierarchy (POTH), which quantifies the certainty in producing a treatment hierarchy from SUCRAs or P-scores. The metric connects three statistical quantities: The variance of the SUCRA values, the variance of the mean rank of each treatment, and the average variance of the distribution of individual ranks for each treatment. POTH provides a single, interpretable value which quantifies the degree of certainty in producing a treatment hierarchy. We show how the metric can be adapted to apply to subsets of treatments in a network, for example, to quantify the certainty in the hierarchy of the top three treatments. We calculate POTH for a database of NMAs to investigate its empirical properties, and we demonstrate its use on three published networks.
AI Key Findings
Get AI-generated insights about this paper's methodology, results, and significance.
Paper Details
PDF Preview
Similar Papers
Found 4 papersProducing treatment hierarchies in network meta-analysis using probabilistic models and treatment-choice criteria
Theodoros Evrenoglou, Adriani Nikolakopoulou, Guido Schwarzer et al.
Effects of combinations of diagnostic and treatment strategies for postpartum haemorrhage: a network meta-analysis.
Yunas, Idnan, Price, Malcolm J, Vigneswaran, Kugajeevan et al.
Nonparametric Bayesian Approach to Treatment Ranking in Network Meta-Analysis with Application to Comparisons of Antidepressants
Garritt L. Page, Lifeng Lin, Andrés F. Barrientos
No citations found for this paper.
Comments (0)