Predicting affective connotation of visualizations from their constituent colors
Publication
Metrics
AI Quick Summary
The study shows that the emotional associations of whole visualizations can be predicted from the emotional meanings of their individual colors (additivity). When color frequency in a colormap biases toward certain colors, weighting by color prevalence improves predictions, and these principles also apply to dot plots and bar charts, enabling automated, affective-aware visualization design.
Paper Preview
Abstract
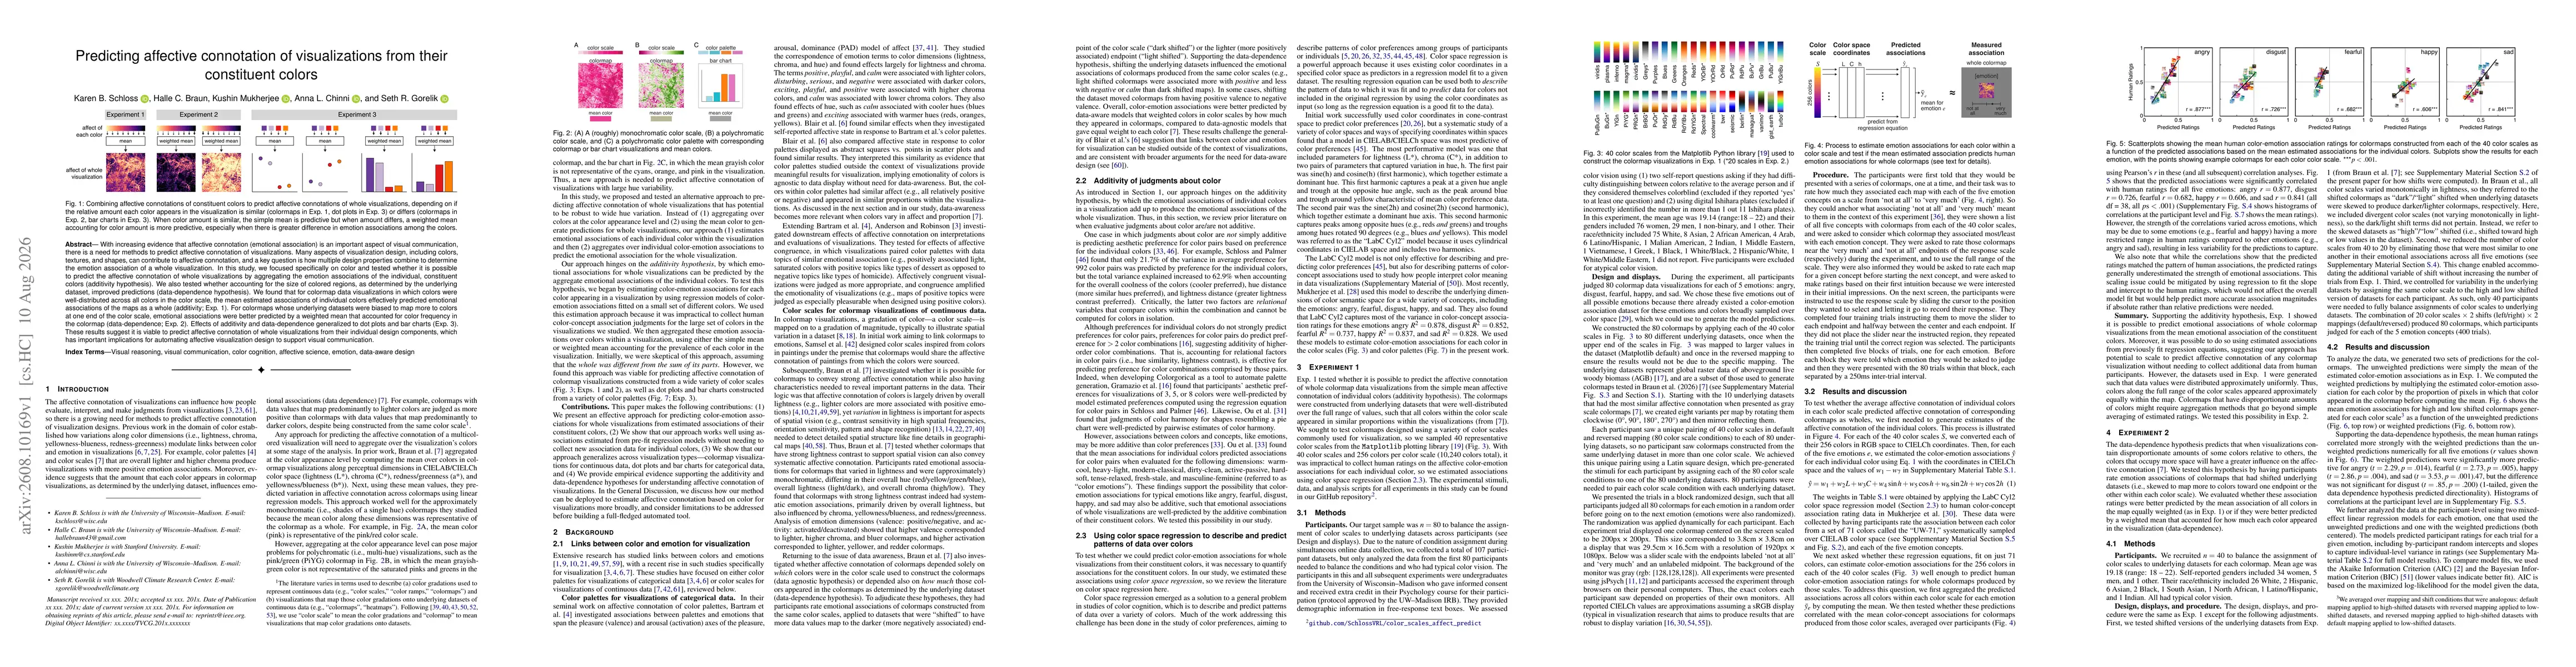
With increasing evidence that affective connotation (emotional association) is an important aspect of visual communication, there is a need for methods to predict affective connotation of visualizations. Many aspects of visualization design, including colors, textures, and shapes, can contribute to affective connotation, and a key question is how multiple design properties combine to determine the emotion association of a whole visualization. In this study, we focused specifically on color and tested whether it is possible to predict the affective connotation of whole visualizations by aggregating the emotion associations of the individual, constituent colors (additivity hypothesis). We also tested whether accounting for the size of colored regions, as determined by the underlying dataset, improved predictions (data-dependence hypothesis). We found that for colormap data visualizations in which colors were well-distributed across all colors in the color scale, the mean estimated associations of individual colors effectively predicted emotional associations of the maps as a whole (additivity; Exp. 1). For colormaps whose underlying datasets were biased to map more to colors at one end of the color scale, emotional associations were better predicted by a weighted mean that accounted for color frequency in the colormap (data-dependence; Exp. 2). Effects of additivity and data-dependence generalized to dot plots and bar charts (Exp. 3). These results suggest it is viable to predict affective connotation of whole visualizations from their individual design components, which has important implications for automating affective visualization design to support visual communication.
AI Key Findings
Get AI-generated insights about this paper's methodology, results, significance, and more — seven facets brought into focus.
Discussion 0