This study predicts household socioeconomic position (SEP) in Mozambique using satellite and household imagery, finding that a convolutional neural network and random forest models yield best results for asset-based SEP when incorporating multimodal imagery. The approach demonstrates the potential to minimize data collection effort while maintaining prediction accuracy through explainable machine learning.
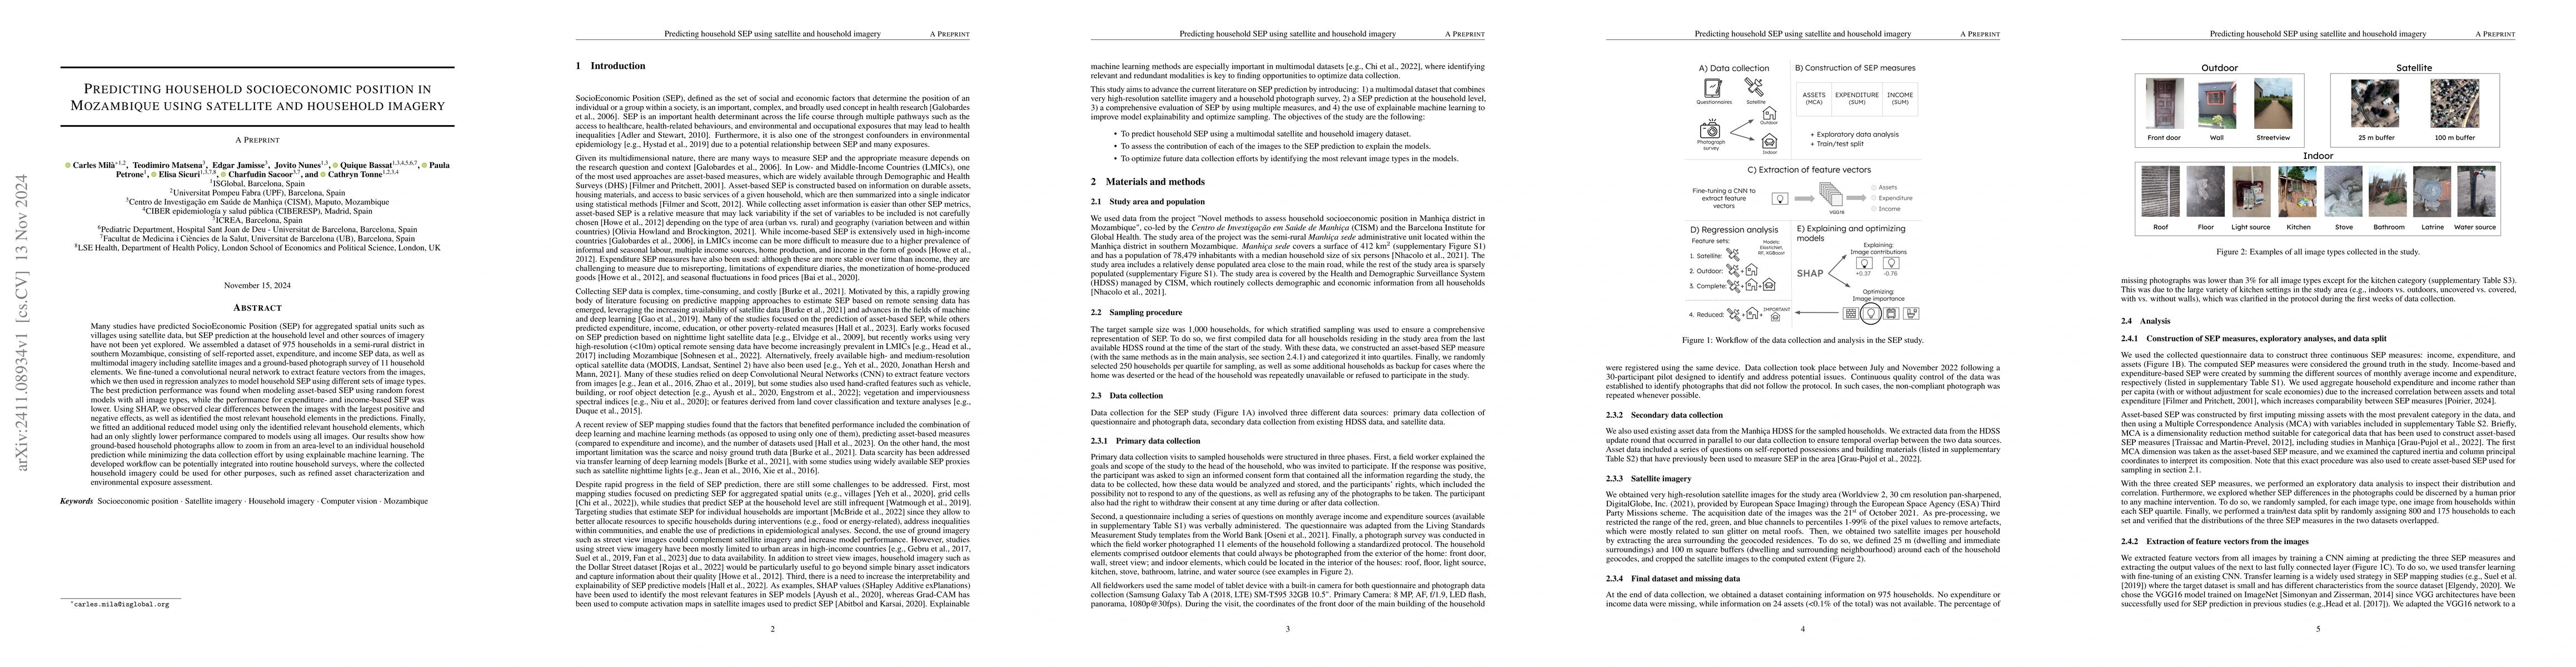
Many studies have predicted SocioEconomic Position (SEP) for aggregated spatial units such as villages using satellite data, but SEP prediction at the household level and other sources of imagery have not been yet explored. We assembled a dataset of 975 households in a semi-rural district in southern Mozambique, consisting of self-reported asset, expenditure, and income SEP data, as well as multimodal imagery including satellite images and a ground-based photograph survey of 11 household elements. We fine-tuned a convolutional neural network to extract feature vectors from the images, which we then used in regression analyzes to model household SEP using different sets of image types. The best prediction performance was found when modeling asset-based SEP using random forest models with all image types, while the performance for expenditure- and income-based SEP was lower. Using SHAP, we observed clear differences between the images with the largest positive and negative effects, as well as identified the most relevant household elements in the predictions. Finally, we fitted an additional reduced model using only the identified relevant household elements, which had an only slightly lower performance compared to models using all images. Our results show how ground-based household photographs allow to zoom in from an area-level to an individual household prediction while minimizing the data collection effort by using explainable machine learning. The developed workflow can be potentially integrated into routine household surveys, where the collected household imagery could be used for other purposes, such as refined asset characterization and environmental exposure assessment.
Get AI-generated insights about this paper's methodology, results, and significance.
Current paper (gray), citations (green), references (blue)
No citations found for this paper.
Title | Authors | Year | Actions |
---|---|---|---|
Systematic comparison of household income, consumption, and assets to measure health inequalities in low- and middle-income countries
|
Mathieu J P Poirier
|
2024
|
View Paper |
Automatic mapping of high-risk urban areas for Aedes aegypti infestation based on building facade image analysis
|
Camila Laranjeira, Matheus B. Pereira, Raul Vitor Ferreira de Oliveira, G. Barbosa, Camila Meireles Fernandes, P. Bermudi, Ester F. R. de Resende, Eduardo A. M. Fernandes, Keiller Nogueira, V. Andrade, José Quintanilha, J. Santos, F. Chiaravalloti-Neto
|
2023
|
View Paper |
Urban visual intelligence: Uncovering hidden city profiles with street view images
|
Zhuangyuan Fan, Fan Zhang, B. Loo, C. Ratti
|
2023
|
View Paper |
A review of machine learning and satellite imagery for poverty prediction: Implications for development research and applications
|
Ola Hall, Francis Dompae, I. Wahab, F. Dzanku
|
2023
|
View Paper |
A review of explainable AI in the satellite data, deep machine learning, and human poverty domain
|
Ola Hall, M. Ohlsson, Thorsteinn S. Rögnvaldsson
|
2022
|
View Paper |
Neighbors’ use of water and sanitation facilities can affect children’s health: a cohort study in Mozambique using a spatial approach
|
B. Grau-Pujol, J. Cano, H. Martí-Soler, A. Casellas, E. Giorgi, A. Nhacolo, F. Saute, R. Giné, L. Quintó, C. Sacoor, José Muñoz
|
2022
|
View Paper |
Using Satellite Data to Guide Urban Poverty Reduction
|
T. Sohnesen, Peter Fisker, David Malmgren-Hansen
|
2021
|
View Paper |
Predicting poverty and malnutrition for targeting, mapping, monitoring, and early warning
|
L. Mcbride, C. Barrett, Christopher Browne, Leiqiu Hu, Yanyan Liu, David S. Matteson, Ying Sun, J. Wen
|
2021
|
View Paper |
Microestimates of wealth for all low- and middle-income countries
|
Guanghua Chi, Han Fang, S. Chatterjee, J. Blumenstock
|
2021
|
View Paper |
Cohort Profile Update: Manhiça Health and Demographic Surveillance System (HDSS) of the Manhiça Health Research Centre (CISM)
|
A. Nhacolo, Edgar Jamisse, O. Augusto, Teodomiro Matsena, Aura Hunguana, I. Mandomando, C. Arnaldo, K. Munguambe, E. Macete, P. Alonso, F. Saute, C. Sacoor
|
2021
|
View Paper |
Seasonality of diet costs reveals food system performance in East Africa
|
Yan Bai, E. Naumova, W. Masters
|
2020
|
View Paper |
Interpretable socioeconomic status inference from aerial imagery through urban patterns
|
Jacob Levy Abitbol, M. Karsai
|
2020
|
View Paper |
Open data for algorithms: mapping poverty in Belize using open satellite derived features and machine learning
|
J. Hersh, R. Engstrom, M. Mann
|
2020
|
View Paper |
Using publicly available satellite imagery and deep learning to understand economic well-being in Africa
|
Christopher Yeh, Anthony Perez, Anne Driscoll, G. Azzari, Zhongyi Tang, D. Lobell, Stefano Ermon, M. Burke
|
2020
|
View Paper |
Measuring urban poverty using multi-source data and a random forest algorithm: A case study in Guangzhou
|
N. Tong, C. Yimin, Yuan Yuan
|
2020
|
View Paper |
Generating Interpretable Poverty Maps using Object Detection in Satellite Images
|
Kumar Ayush, Burak Uzkent, M. Burke, D. Lobell, Stefano Ermon
|
2020
|
View Paper |
From local explanations to global understanding with explainable AI for trees
|
Scott M. Lundberg, G. Erion, Hugh Chen, A. DeGrave, J. Prutkin, B. Nair, R. Katz, J. Himmelfarb, N. Bansal, Su-In Lee
|
2020
|
View Paper |
Using satellite imagery to understand and promote sustainable development
|
M. Burke, Anne Driscoll, D. Lobell, Stefano Ermon
|
2019
|
View Paper |
Interpretable Machine Learning
|
Bradley C. Boehmke, Brandon M. Greenwell
|
2019
|
View Paper |
The multiple meanings of prosperity and poverty: a cross-site comparison from Tanzania
|
O. Howland, C. Noe, D. Brockington
|
2019
|
View Paper |
Approaches and Alternatives to the Wealth Index to Measure Socioeconomic Status Using Survey Data: A Critical Interpretive Synthesis
|
Mathieu J. P. Poirier, K. Grépin, M. Grignon
|
2019
|
View Paper |
Computational socioeconomics
|
Jian Gao, Yi-Cheng Zhang, Tao Zhou
|
2019
|
View Paper |
Health Effects of Household Solid Fuel Use: Findings from 11 Countries within the Prospective Urban and Rural Epidemiology Study
|
P. Hystad, M. Duong, M. Brauer, A. Larkin, Raphael E. Arku, O. Kurmi, W. Fan, Á. Avezum, I. Azam, J. Chifamba, A. Dans, J. D. du Plessis, Rajeev Gupta, R. Kumar, F. Lanas, Zhiguang Liu, Yin Lu, P. López-Jaramillo, P. Mony, V. Mohan, D. Mohan, S. Nair, T. Puoane, O. Rahman, Ah Tse Lap, Yanga Wang, Li Wei, K. Yeates, S. Rangarajan, K. Teo, S. Yusuf
|
2019
|
View Paper |
Measuring social, environmental and health inequalities using deep learning and street imagery
|
Esra Suel, J. Polak, J. Bennett, M. Ezzati
|
2019
|
View Paper |
Estimation of Poverty Using Random Forest Regression with Multi-Source Data: A Case Study in Bangladesh
|
Xizhi Zhao, Bailang Yu, Yan Liu, Zuoqi Chen, Qiaoxuan Li, Congxiao Wang, Jianping Wu
|
2019
|
View Paper |
Socioecologically informed use of remote sensing data to predict rural household poverty
|
Gary R. Watmough, C. Marcinko, Clare Sullivan, Kevin Tschirhart, P. Mutuo, C. Palm, Jens‐Christian Svenning
|
2019
|
View Paper |
A picture tells a thousand … exposures: Opportunities and challenges of deep learning image analyses in exposure science and environmental epidemiology
|
S. Weichenthal, M. Hatzopoulou, M. Brauer
|
2018
|
View Paper |
The consumption, income, and wealth of the poorest: An empirical analysis of economic inequality in rural and urban Sub-Saharan Africa for macroeconomists
|
L. D. Magalhães, Raül Santaeulàlia-Llopis
|
2018
|
View Paper |
Poverty from Space: Using High-Resolution Satellite Imagery for Estimating Economic Well-Being
|
R. Engstrom, J. Hersh, David Newhouse
|
2017
|
View Paper |
Can Human Development be Measured with Satellite Imagery?
|
Andrew Head, Mélanie Manguin, Nhat Tran, J. Blumenstock
|
2017
|
View Paper |
VIIRS night-time lights
|
C. Elvidge, K. Baugh, M. Zhizhin, F. Hsu, T. Ghosh
|
2017
|
View Paper |
Using deep learning and Google Street View to estimate the demographic makeup of neighborhoods across the United States
|
Timnit Gebru, J. Krause, Yilun Wang, Duyun Chen, Jia Deng, Erez Aiden Lieberman, Li Fei-Fei
|
2017
|
View Paper |
Combining satellite imagery and machine learning to predict poverty
|
Neal Jean, M. Burke, Sang Michael Xie, W. Davis, D. Lobell, Stefano Ermon
|
2016
|
View Paper |
XGBoost: A Scalable Tree Boosting System
|
Tianqi Chen, Carlos Guestrin
|
2016
|
View Paper |
Transfer Learning from Deep Features for Remote Sensing and Poverty Mapping
|
Sang Michael Xie, Neal Jean, M. Burke, D. Lobell, Stefano Ermon
|
2015
|
View Paper |
Measuring intra-urban poverty using land cover and texture metrics derived from remote sensing data
|
J. Duque, Jorge E. Patiño, L. Ruiz, J. Pardo-Pascual
|
2015
|
View Paper |
How transferable are features in deep neural networks?
|
J. Yosinski, J. Clune, Yoshua Bengio, Hod Lipson
|
2014
|
View Paper |
Very Deep Convolutional Networks for Large-Scale Image Recognition
|
K. Simonyan, Andrew Zisserman
|
2014
|
View Paper |
CNN Features Off-the-Shelf: An Astounding Baseline for Recognition
|
A. Razavian, Hossein Azizpour, Josephine Sullivan, S. Carlsson
|
2014
|
View Paper |
Alternatives to principal components analysis to derive asset-based indices to measure socio-economic position in low- and middle-income countries: the case for multiple correspondence analysis.
|
P. Traissac, Y. Martin-Prével
|
2012
|
View Paper |
Measuring socio-economic position for epidemiological studies in low- and middle-income countries: a methods of measurement in epidemiology paper
|
L. Howe, B. Galobardes, A. Matijasevich, David Gordon, D. Johnston, O. Onwujekwe, R. Patel, E. Webb, D. Lawlor, J. Hargreaves
|
2012
|
View Paper |
Health disparities across the lifespan: Meaning, methods, and mechanisms
|
N. Adler, J. Stewart
|
2010
|
View Paper |
A global poverty map derived from satellite data
|
C. Elvidge, P. Sutton, T. Ghosh, B. Tuttle, K. Baugh, B. Bhaduri, E. Bright
|
2009
|
View Paper |
Is the wealth index a proxy for consumption expenditure? A systematic review
|
L. Howe, J. Hargreaves, S. Gabrysch, Sharon R. A. Huttly
|
2009
|
View Paper |
Python 3 Reference Manual
|
G. Rossum, F. Drake
|
2009
|
View Paper |
Assessing Asset Indices
|
D. Filmer, K. Scott
|
2008
|
View Paper |
Indicators of socioeconomic position (part 1)
|
B. Galobardes, M. Shaw, D. Lawlor, J. Lynch, G. Davey Smith
|
2005
|
View Paper |
Addendum: Regularization and variable selection via the elastic net
|
H. Zou, T. Hastie
|
2005
|
View Paper |
Estimating Wealth Effects Without Expenditure Data—Or Tears: An Application To Educational Enrollments In States Of India*
|
D. Filmer, Lant Pritchett
|
2001
|
View Paper |
Validity of rapid estimates of household wealth and income for health surveys in rural Africa
|
S. Morris, C. Carletto, J. Hoddinott, L. Christiaensen
|
2000
|
View Paper |
The Dollar Street Dataset: Images Representing the Geographic and Socioeconomic Diversity of the World
|
W. G. Rojas, Sudnya Diamos, K. R. Kini, David Kanter, V. Reddi, Cody Coleman
|
2022
|
View Paper |
Capturing What Matters: Essential Guidelines for Designing Household Surveys
|
2021
|
||
Deep learning for vision systems
|
2020
|
||
Random Forests
|
L. Breiman
|
2001
|
View Paper |
Predicting household SEP using satellite and household imagery
|
|||
R Core Team
|
Showing first page preview. Click "Open Full PDF" to view the complete paper.
Your comment contains inappropriate language and has been rejected.
Are you sure you want to remove this tag? This action cannot be undone.
Someone just favorited a paper!
Comments (0)