Predicting housing prices and analyzing real estate market in the Chicago suburbs using Machine Learning
Publication
Metrics
AI Quick Summary
This study predicts housing prices in the Naperville/Bolingbrook suburbs of Chicago using various machine learning models, including linear regression, support vector regression, decision tree regression, random forest regression, and XGBoost regression. The XGBoost model was found to outperform others in predicting house prices amidst post-pandemic market volatility, as evaluated by MAE, RMSE, and R-squared metrics.
Paper Preview
Abstract
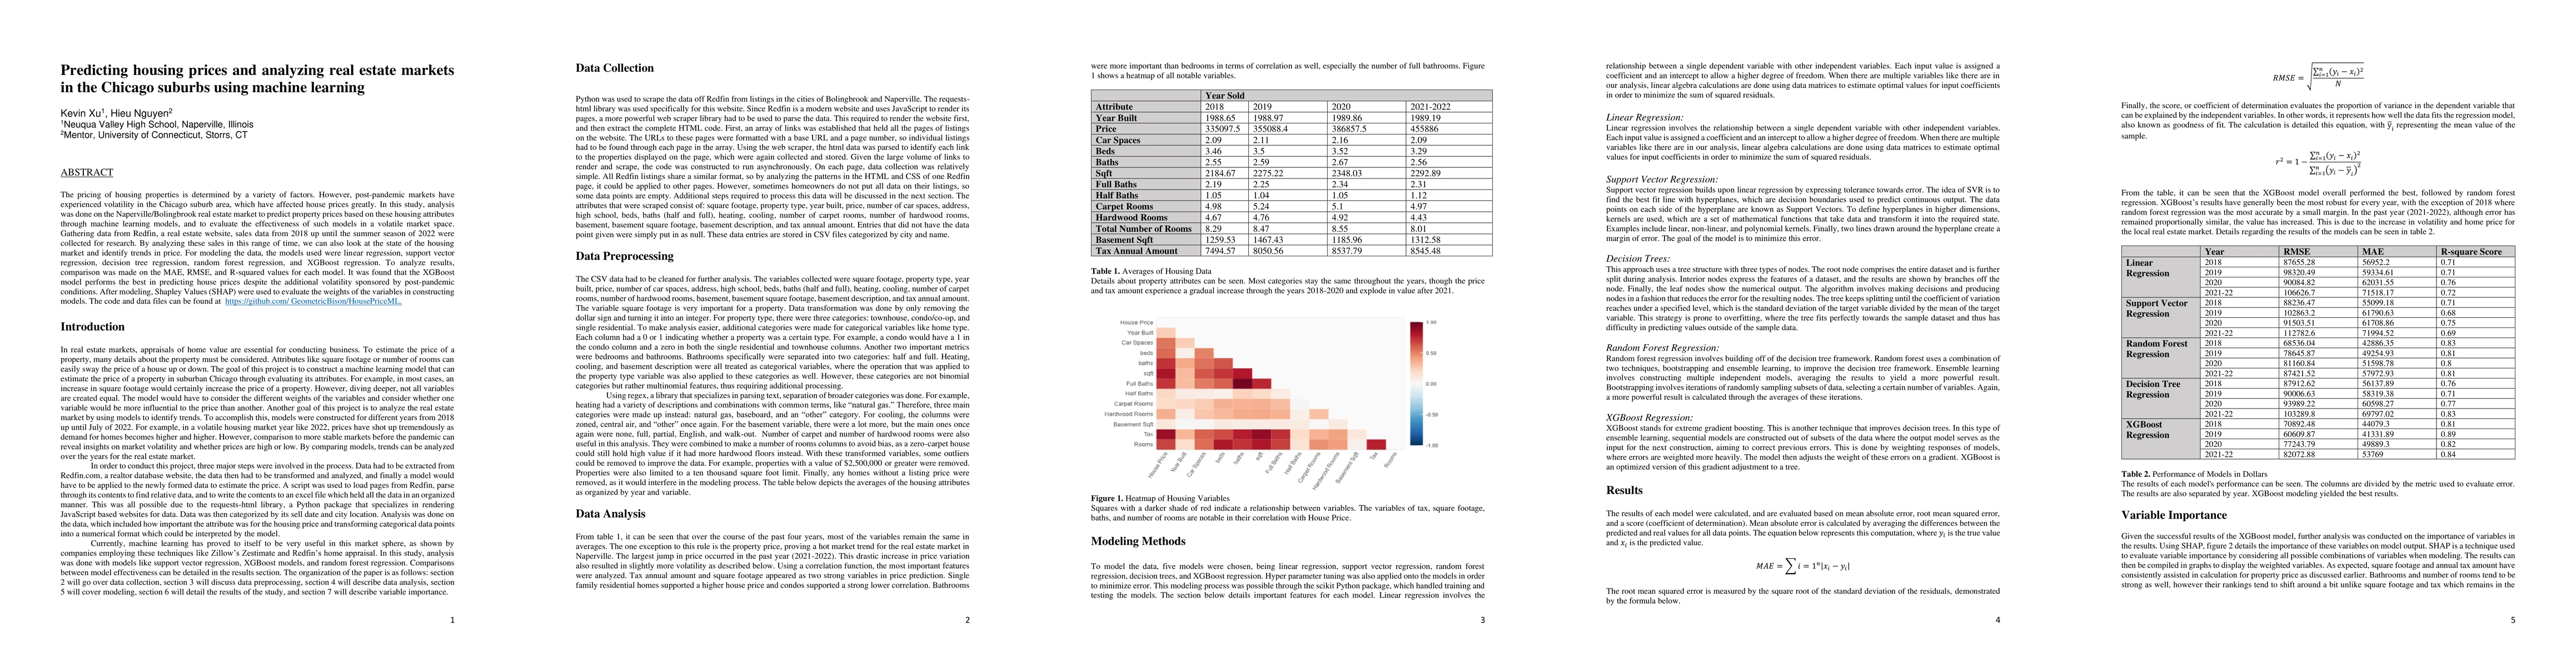
The pricing of housing properties is determined by a variety of factors. However, post-pandemic markets have experienced volatility in the Chicago suburb area, which have affected house prices greatly. In this study, analysis was done on the Naperville/Bolingbrook real estate market to predict property prices based on these housing attributes through machine learning models, and to evaluate the effectiveness of such models in a volatile market space. Gathering data from Redfin, a real estate website, sales data from 2018 up until the summer season of 2022 were collected for research. By analyzing these sales in this range of time, we can also look at the state of the housing market and identify trends in price. For modeling the data, the models used were linear regression, support vector regression, decision tree regression, random forest regression, and XGBoost regression. To analyze results, comparison was made on the MAE, RMSE, and R-squared values for each model. It was found that the XGBoost model performs the best in predicting house prices despite the additional volatility sponsored by post-pandemic conditions. After modeling, Shapley Values (SHAP) were used to evaluate the weights of the variables in constructing models.
AI Key Findings
Get AI-generated insights about this paper's methodology, results, significance, and more — seven facets brought into focus.
Impact
Paper Details
Authors
PDF Preview
Key Terms
Citation Network
Current paper (gray), citations (green), references (blue)
Display is limited for performance on very large graphs.
Discussion 0