Predicting Station-level Hourly Demands in a Large-scale Bike-sharing Network: A Graph Convolutional Neural Network Approach
Publication
Metrics
AI Quick Summary
This study introduces a GCNN-DDGF model to predict hourly demand in a large-scale bike-sharing network, exploring two architectures to capture spatial and temporal dependencies. The best-performing model, GCNNrec-DDGF, outperforms other benchmarks, revealing hidden station correlations beyond traditional adjacency matrices.
Paper Preview
Abstract
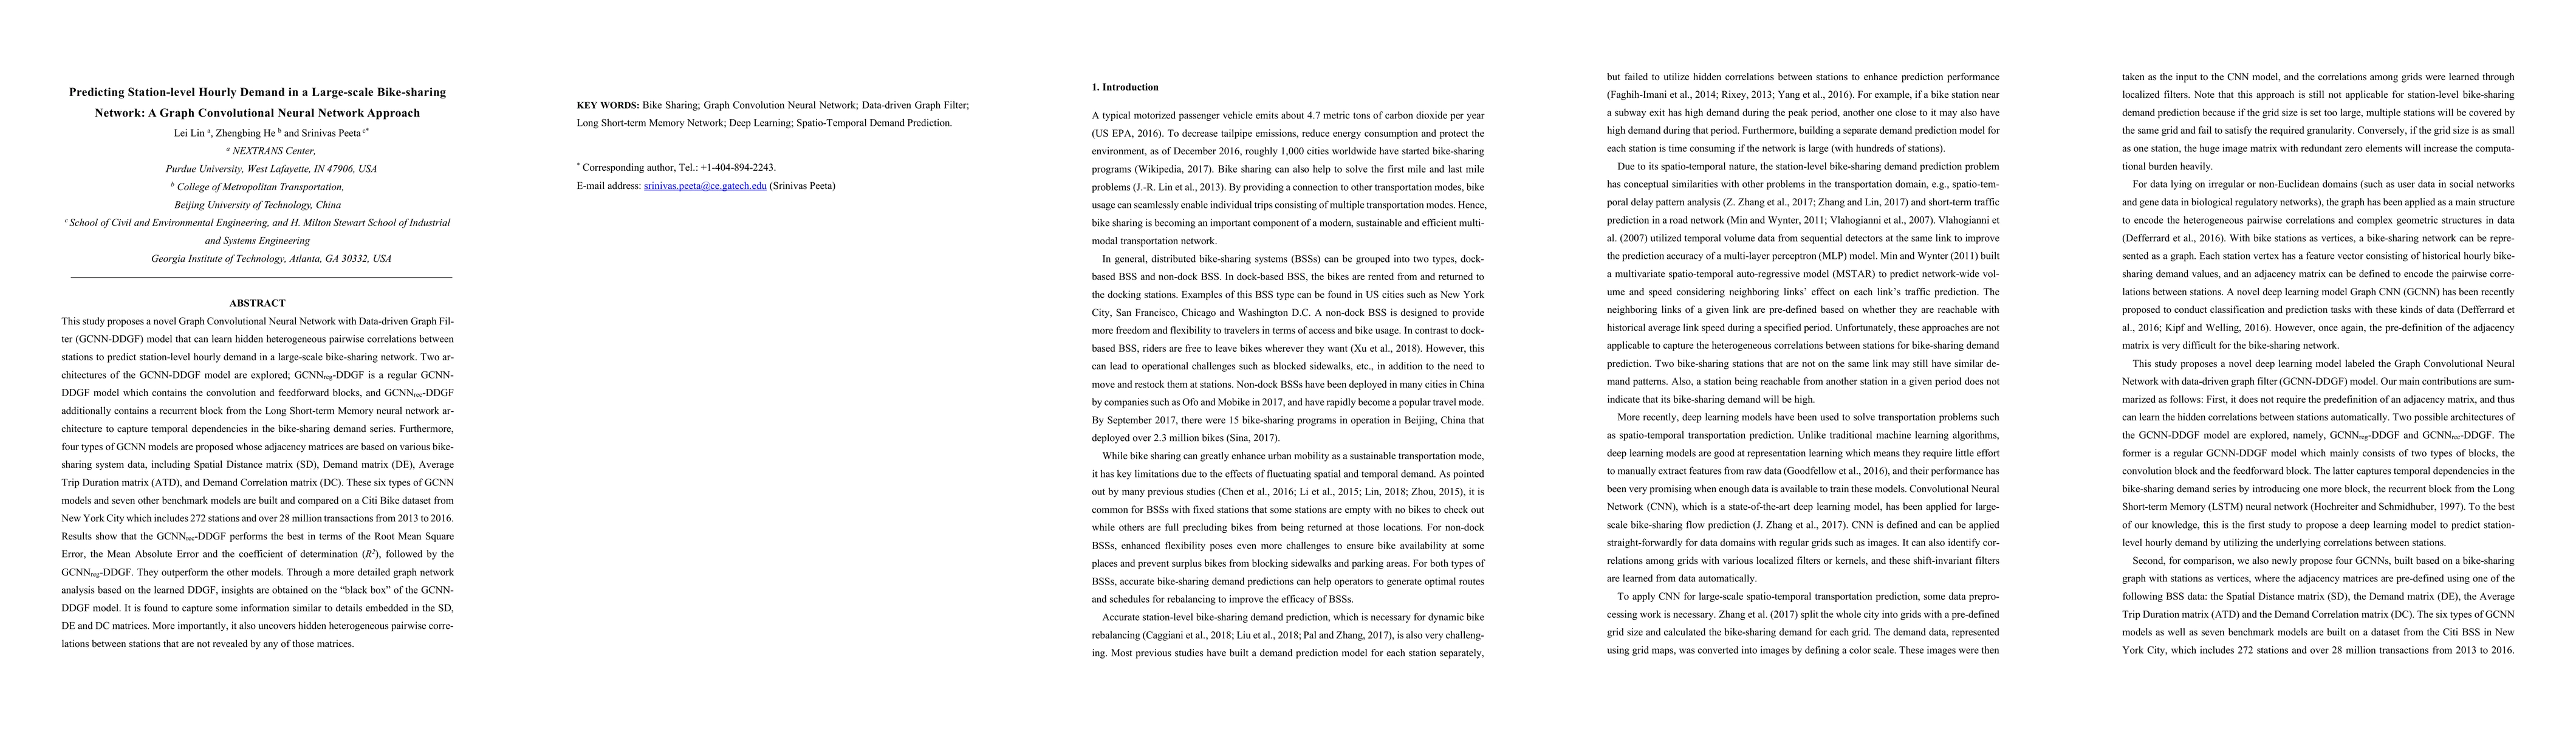
This study proposes a novel Graph Convolutional Neural Network with Data-driven Graph Filter (GCNN-DDGF) model that can learn hidden heterogeneous pairwise correlations between stations to predict station-level hourly demand in a large-scale bike-sharing network. Two architectures of the GCNN-DDGF model are explored; GCNNreg-DDGF is a regular GCNN-DDGF model which contains the convolution and feedforward blocks, and GCNNrec-DDGF additionally contains a recurrent block from the Long Short-term Memory neural network architecture to capture temporal dependencies in the bike-sharing demand series. Furthermore, four types of GCNN models are proposed whose adjacency matrices are based on various bike-sharing system data, including Spatial Distance matrix (SD), Demand matrix (DE), Average Trip Duration matrix (ATD), and Demand Correlation matrix (DC). These six types of GCNN models and seven other benchmark models are built and compared on a Citi Bike dataset from New York City which includes 272 stations and over 28 million transactions from 2013 to 2016. Results show that the GCNNrec-DDGF performs the best in terms of the Root Mean Square Error, the Mean Absolute Error and the coefficient of determination (R2), followed by the GCNNreg-DDGF. They outperform the other models. Through a more detailed graph network analysis based on the learned DDGF, insights are obtained on the black box of the GCNN-DDGF model. It is found to capture some information similar to details embedded in the SD, DE and DC matrices. More importantly, it also uncovers hidden heterogeneous pairwise correlations between stations that are not revealed by any of those matrices.
AI Key Findings
Get AI-generated insights about this paper's methodology, results, significance, and more — seven facets brought into focus.
Impact
Paper Details
PDF Preview
Key Terms
Citation Network
Current paper (gray), citations (green), references (blue)
Display is limited for performance on very large graphs.
Discussion 0