Predicting Three Types of Freezing of Gait Events Using Deep Learning Models
Publication
Metrics
AI Quick Summary
This paper develops deep learning models to predict three types of freezing of gait events in Parkinson's Disease patients, using transformer encoders and Bidirectional LSTM layers. The best model achieves a top 5 ranking in a Kaggle competition but shows signs of overfitting that could be mitigated with further data and model refinement.
Paper Preview
Abstract
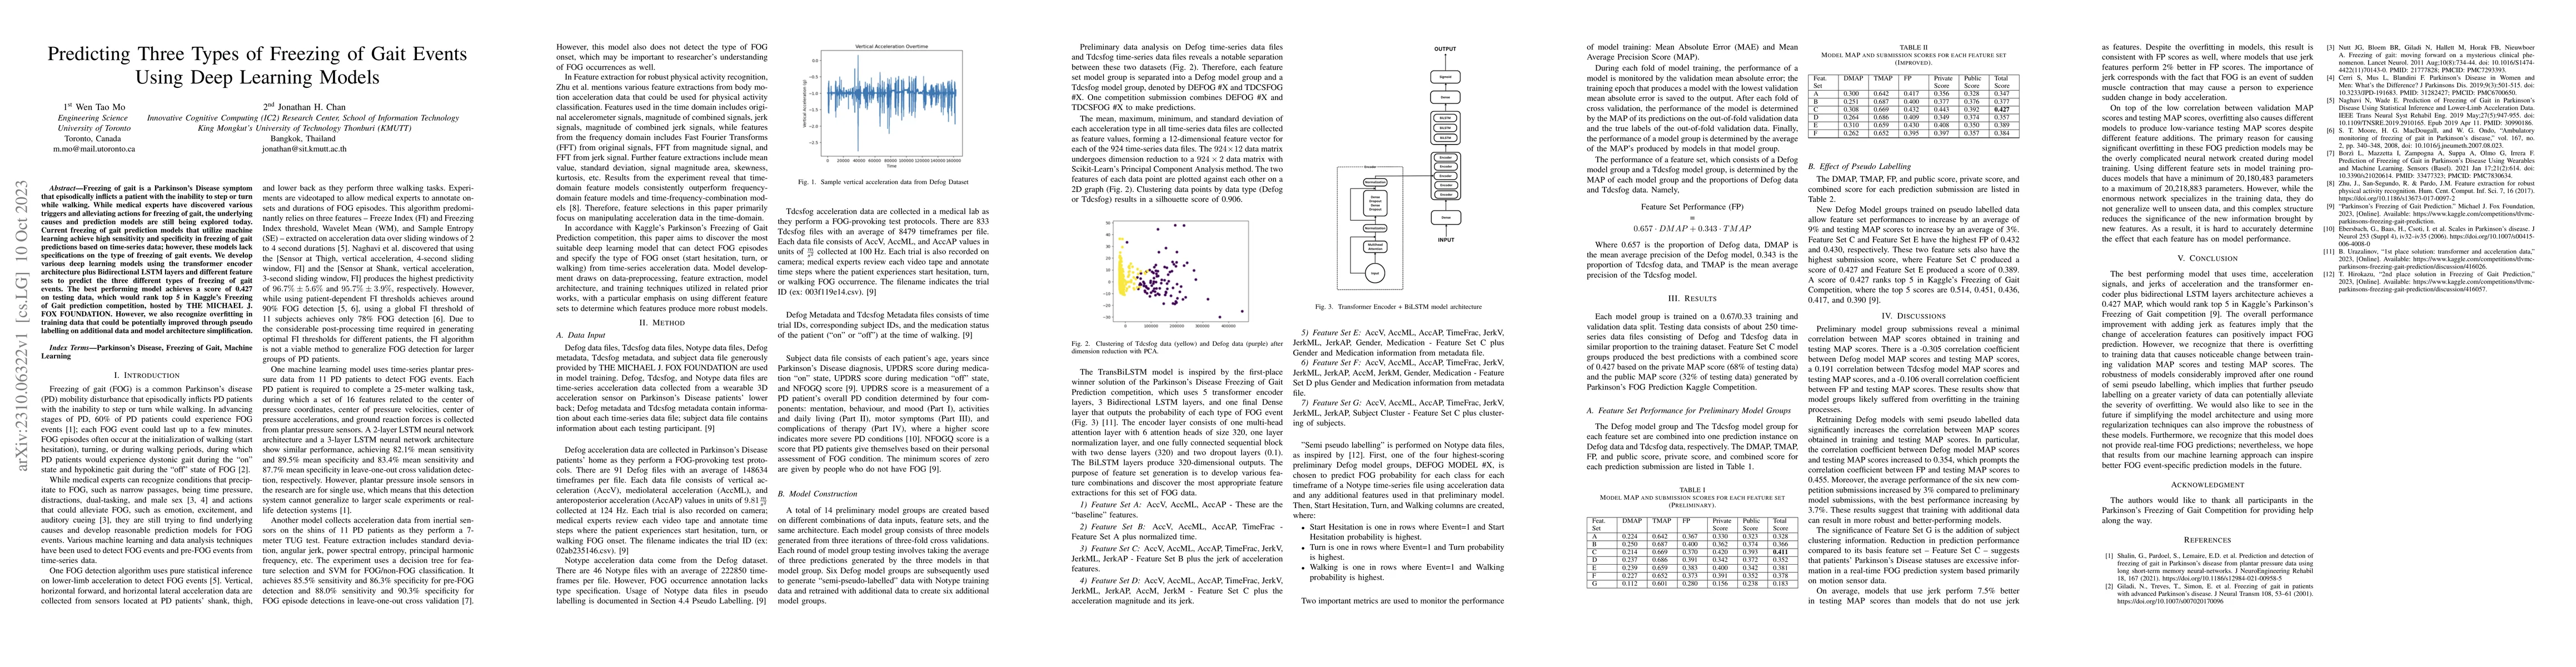
Freezing of gait is a Parkinson's Disease symptom that episodically inflicts a patient with the inability to step or turn while walking. While medical experts have discovered various triggers and alleviating actions for freezing of gait, the underlying causes and prediction models are still being explored today. Current freezing of gait prediction models that utilize machine learning achieve high sensitivity and specificity in freezing of gait predictions based on time-series data; however, these models lack specifications on the type of freezing of gait events. We develop various deep learning models using the transformer encoder architecture plus Bidirectional LSTM layers and different feature sets to predict the three different types of freezing of gait events. The best performing model achieves a score of 0.427 on testing data, which would rank top 5 in Kaggle's Freezing of Gait prediction competition, hosted by THE MICHAEL J. FOX FOUNDATION. However, we also recognize overfitting in training data that could be potentially improved through pseudo labelling on additional data and model architecture simplification.
AI Key Findings
Get AI-generated insights about this paper's methodology, results, significance, and more — seven facets brought into focus.
Impact
Paper Details
Authors
PDF Preview
Key Terms
Citation Network
Current paper (gray), citations (green), references (blue)
Display is limited for performance on very large graphs.
Discussion 0