Summary
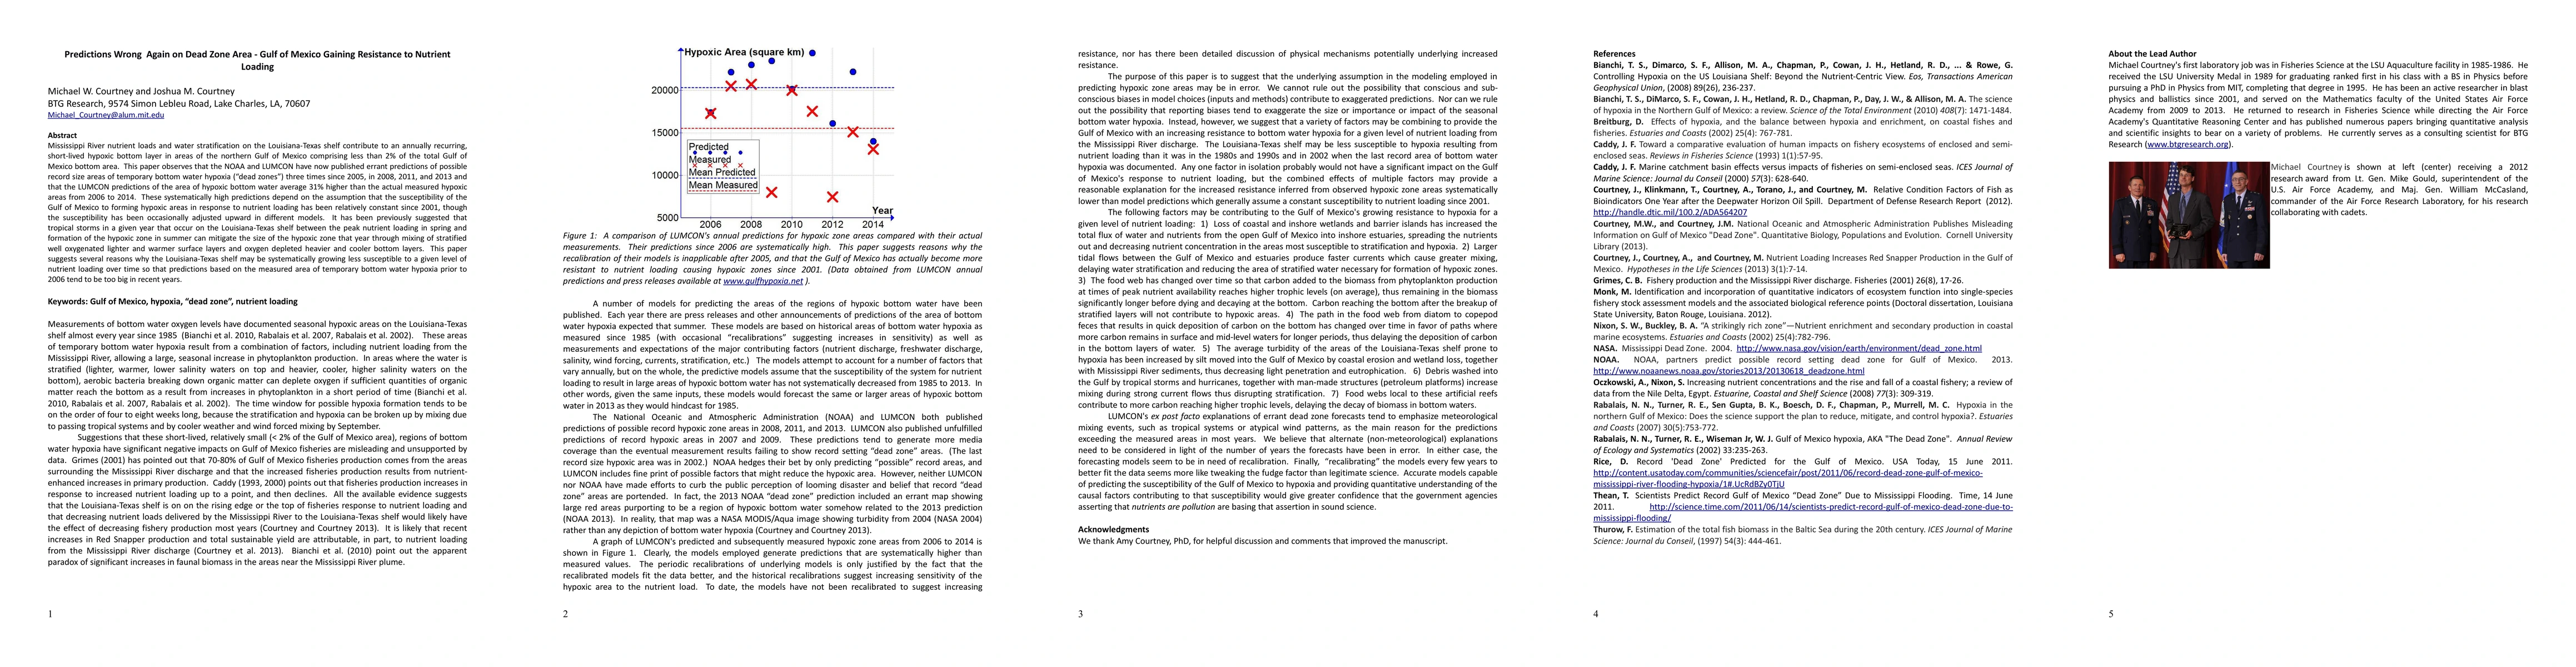
Mississippi River nutrient loads and water stratification on the Louisiana-Texas shelf contribute to an annually recurring, short-lived hypoxic bottom layer in areas of the northern Gulf of Mexico comprising less than 2% of the total Gulf of Mexico bottom area. This paper observes that the NOAA and LUMCON have now published errant predictions of possible record size areas of temporary bottom water hypoxia ("dead zones") three times since 2005, in 2008, 2011, and 2013 and that the LUMCON predictions of the area of hypoxic bottom water average 31% higher than the actual measured hypoxic areas from 2006 to 2014. These systematically high predictions depend on the assumption that the susceptibility of the Gulf of Mexico to forming hypoxic areas in response to nutrient loading has been relatively constant since 2001, though the susceptibility has been occasionally adjusted upward in different models. It has been previously suggested that tropical storms in a given year that occur on the Louisiana-Texas shelf between the peak nutrient loading in spring and formation of the hypoxic zone in summer can mitigate the size of the hypoxic zone that year through mixing of stratified well oxygenated lighter and warmer surface layers and oxygen depleted heavier and cooler bottom layers. This paper suggests several reasons why the Louisiana-Texas shelf may be systematically growing less susceptible to a given level of nutrient loading over time so that predictions based on the measured area of temporary bottom water hypoxia prior to 2006 tend to be too big in recent years.
AI Key Findings
Get AI-generated insights about this paper's methodology, results, and significance.
Paper Details
PDF Preview
Key Terms
Citation Network
Current paper (gray), citations (green), references (blue)
Display is limited for performance on very large graphs.
Similar Papers
Found 4 papersMultiple Equilibrium States of the Loop Current in the Gulf of Mexico
Vitalii A. Sheremet, Arham Amin Khan, Joseph Kuehl
No citations found for this paper.
Comments (0)