Preliminary mapping of ionospheric total electron content (TEC) over Ecuador using global positioning system (GPS) data
Publication
Metrics
AI Quick Summary
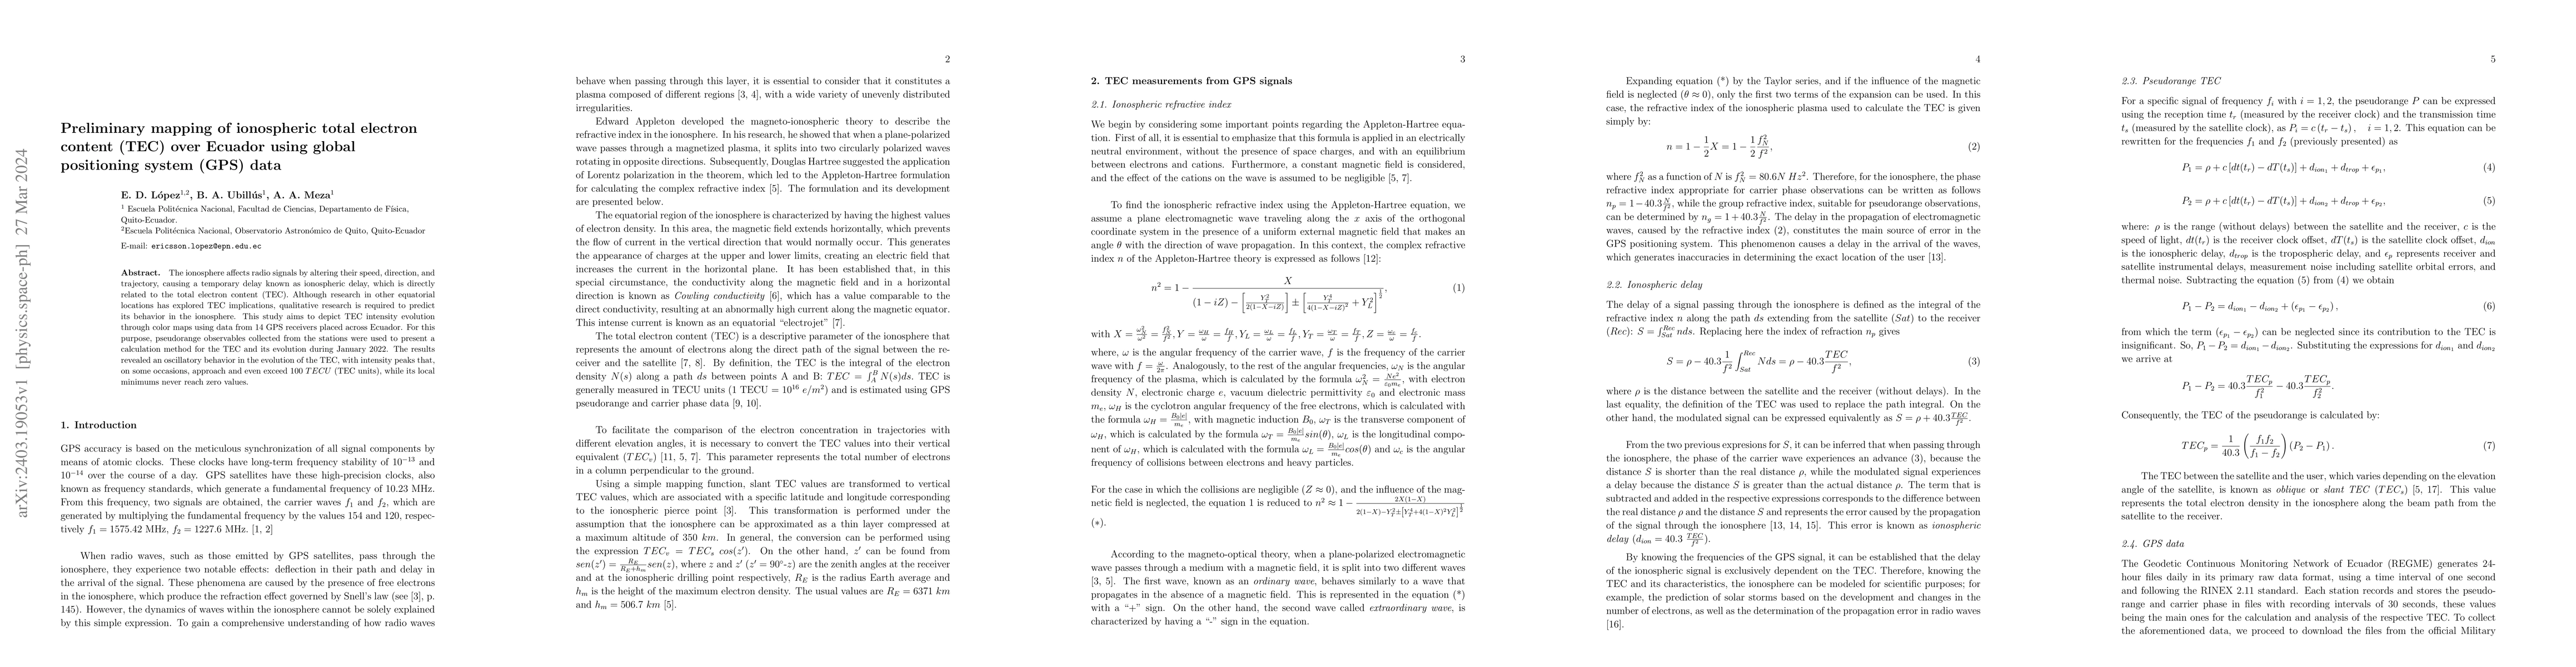
This study maps ionospheric total electron content (TEC) over Ecuador using GPS data, revealing oscillatory TEC evolution with peaks near 100 TECU and non-zero minimums, as calculated from 14 GPS receivers across the country in January 2022.
Paper Preview
Abstract
The ionosphere affects radio signals by altering their speed, direction, and trajectory, causing a temporary delay known as ionospheric delay, which is directly related to the total electron content (TEC). Although research in other equatorial locations has explored TEC implications, qualitative research is required to predict its behavior in the ionosphere. This study aims to depict TEC intensity evolution through color maps using data from 14 GPS receivers placed across Ecuador. For this purpose, pseudorange observables collected from the stations were used to present a calculation method for the TEC and its evolution during January 2022. The results revealed an oscillatory behavior in the evolution of the TEC, with intensity peaks that, on some occasions, approach and even exceed 100 T ECU (TEC units), while its local minimums never reach zero values.
AI Key Findings
Get AI-generated insights about this paper's methodology, results, significance, and more — seven facets brought into focus.
Impact
Paper Details
Authors
PDF Preview
Key Terms
Citation Network
Current paper (gray), citations (green), references (blue)
Display is limited for performance on very large graphs.
Discussion 0