Summary
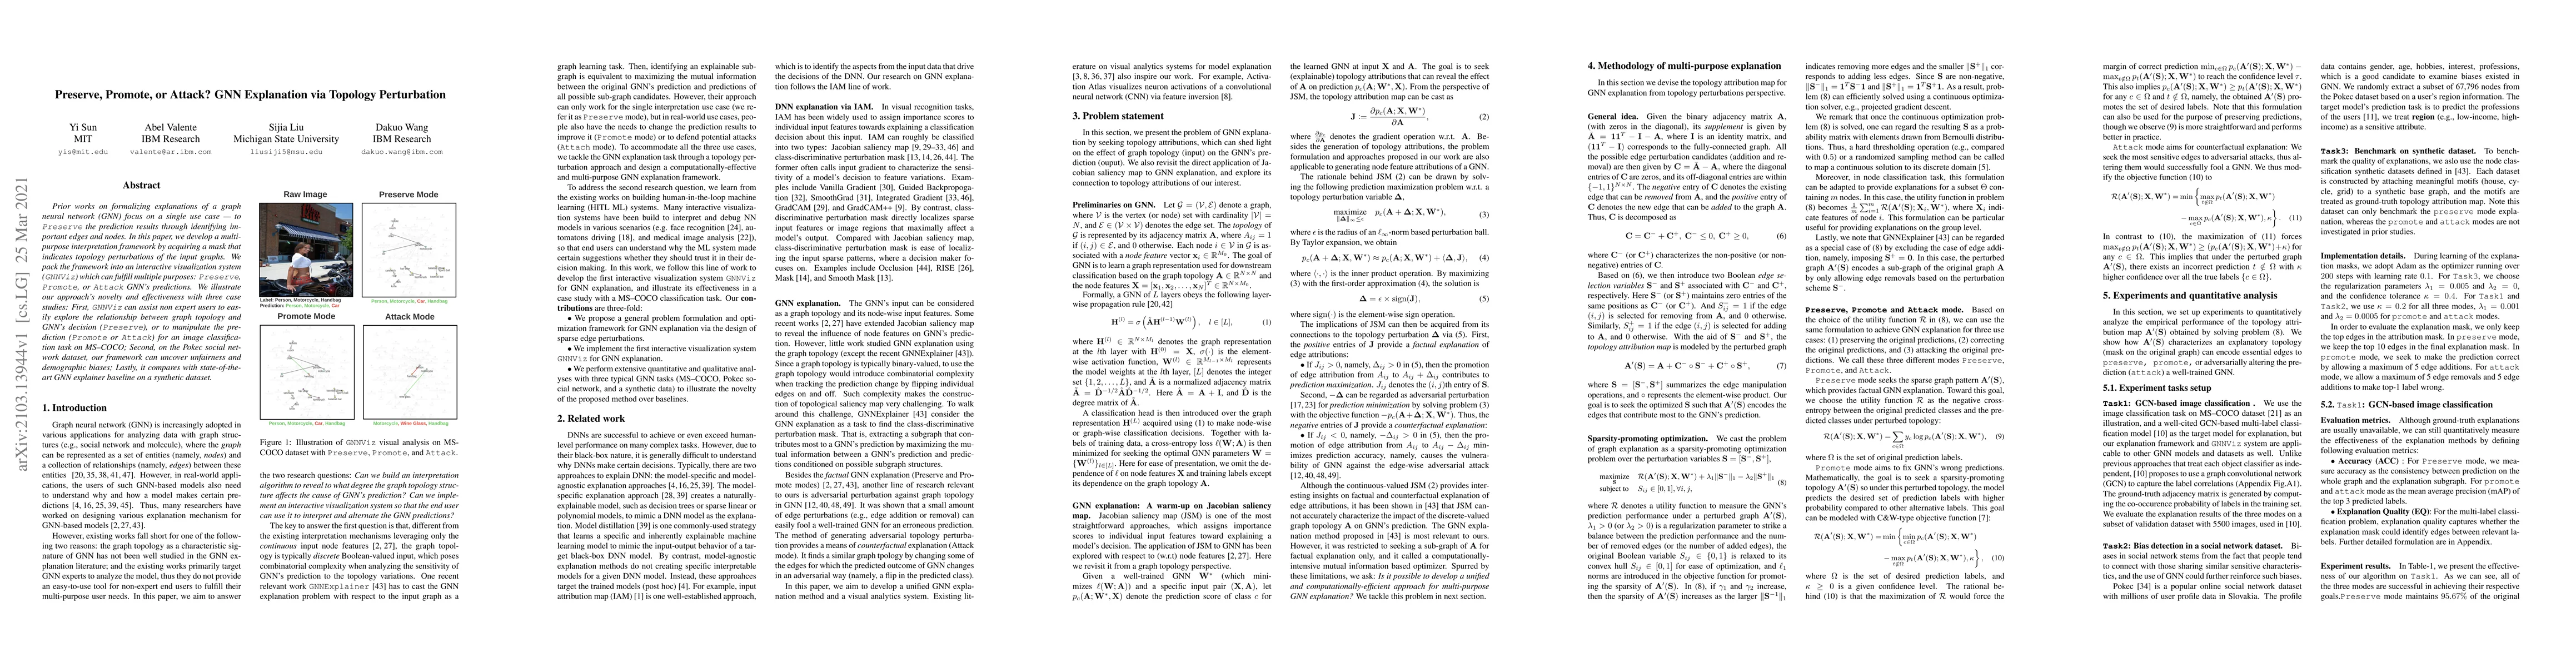
Prior works on formalizing explanations of a graph neural network (GNN) focus on a single use case - to preserve the prediction results through identifying important edges and nodes. In this paper, we develop a multi-purpose interpretation framework by acquiring a mask that indicates topology perturbations of the input graphs. We pack the framework into an interactive visualization system (GNNViz) which can fulfill multiple purposes: Preserve,Promote, or Attack GNN's predictions. We illustrate our approach's novelty and effectiveness with three case studies: First, GNNViz can assist non expert users to easily explore the relationship between graph topology and GNN's decision (Preserve), or to manipulate the prediction (Promote or Attack) for an image classification task on MS-COCO; Second, on the Pokec social network dataset, our framework can uncover unfairness and demographic biases; Lastly, it compares with state-of-the-art GNN explainer baseline on a synthetic dataset.
AI Key Findings
Get AI-generated insights about this paper's methodology, results, and significance.
Paper Details
PDF Preview
Key Terms
Citation Network
Current paper (gray), citations (green), references (blue)
Display is limited for performance on very large graphs.
Similar Papers
Found 4 papersEfficient GNN Explanation via Learning Removal-based Attribution
Zirui Liu, Enkelejda Kasneci, Qizhang Feng et al.
$β$-GNN: A Robust Ensemble Approach Against Graph Structure Perturbation
Philipp Wiesner, Ping Xiong, Odej Kao et al.
Probing GNN Explainers: A Rigorous Theoretical and Empirical Analysis of GNN Explanation Methods
Marinka Zitnik, Himabindu Lakkaraju, Chirag Agarwal
| Title | Authors | Year | Actions |
|---|
Comments (0)