01
MethodologyHow they did it
Brief description of the research methodology used
This paper develops an interactive ASCII visualization for Spack's dependency graphs to maintain command line workflow efficiency. Through user interviews and a command line-centered study, the proposed visualization is preferred over existing methods despite its ASCII limitations.
This paper develops an interactive ASCII visualization for Spack's dependency graphs to maintain command line workflow efficiency. Through user interviews and a command line-centered study, the proposed visualization is preferred over existing methods despite its ASCII limitations.
Brief description of the research methodology used More in Methodology →
Main finding 1: Graphical solution with more customized interactivity may be preferable to all three options. — Main finding 2: The graphical solution with terminal-based navigation was preferred by participants. More in Key Results →
This research is important because it examines usage coming from a command-line workflow and its potential impact on users' preferences. More in Significance →
Limitation 1: The study design was limited by the task complexity and the number of participants recruited. — Limitation 2: The study did not account for the cost of obtaining graphical representations, which may be a barrier to adoption. More in Limitations →
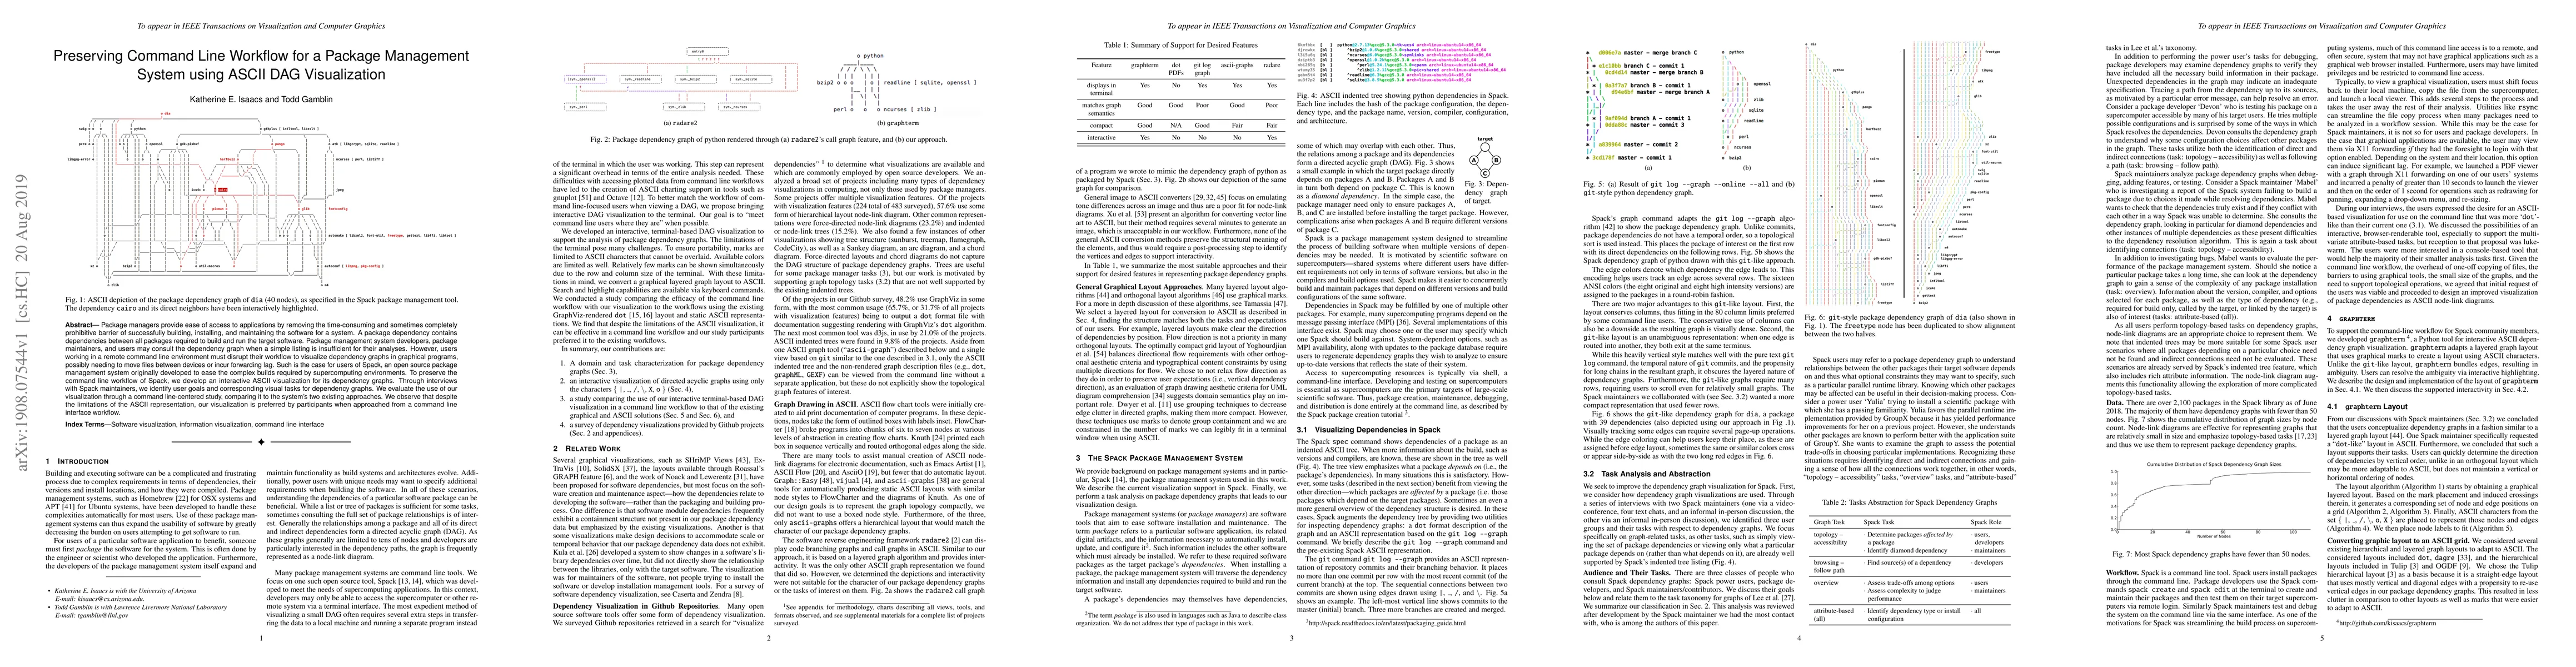
Package managers provide ease of access to applications by removing the time-consuming and sometimes completely prohibitive barrier of successfully building, installing, and maintaining the software for a system. A package dependency contains dependencies between all packages required to build and run the target software. Package management system developers, package maintainers, and users may consult the dependency graph when a simple listing is insufficient for their analyses. However, users working in a remote command line environment must disrupt their workflow to visualize dependency graphs in graphical programs, possibly needing to move files between devices or incur forwarding lag. Such is the case for users of Spack, an open source package management system originally developed to ease the complex builds required by supercomputing environments. To preserve the command line workflow of Spack, we develop an interactive ASCII visualization for its dependency graphs. Through interviews with Spack maintainers, we identify user goals and corresponding visual tasks for dependency graphs. We evaluate the use of our visualization through a command line-centered study, comparing it to the system's two existing approaches. We observe that despite the limitations of the ASCII representation, our visualization is preferred by participants when approached from a command line interface workflow.
Seven facets of this paper, analysed and brought into focus by AI.
This research is important because it examines usage coming from a command-line workflow and its potential impact on users' preferences.
Brief description of the research methodology used
This research is important because it examines usage coming from a command-line workflow and its potential impact on users' preferences.
The research contributes to the understanding of users' preferences for graphical solutions, particularly in the context of command-line workflows.
This work is novel because it examines the interplay between visualization and workflow in a specific domain (Spack) and provides insights into users' preferences.
Current paper (gray), citations (green), references (blue)
Display is limited for performance on very large graphs.
Discussion 0