Publication
Metrics
AI Quick Summary
This study uses principal component analysis on XMM-Newton data to analyze the spectral variability of MCG--06-30-15, revealing that 99% of the variability is captured by three main components: variations in the powerlaw continuum, photon index, and relativistically blurred reflection spectrum. The analysis confirms that these components are variable on timescales as short as 1 ks, indicating proximity to the central black hole.
Paper Preview
Abstract
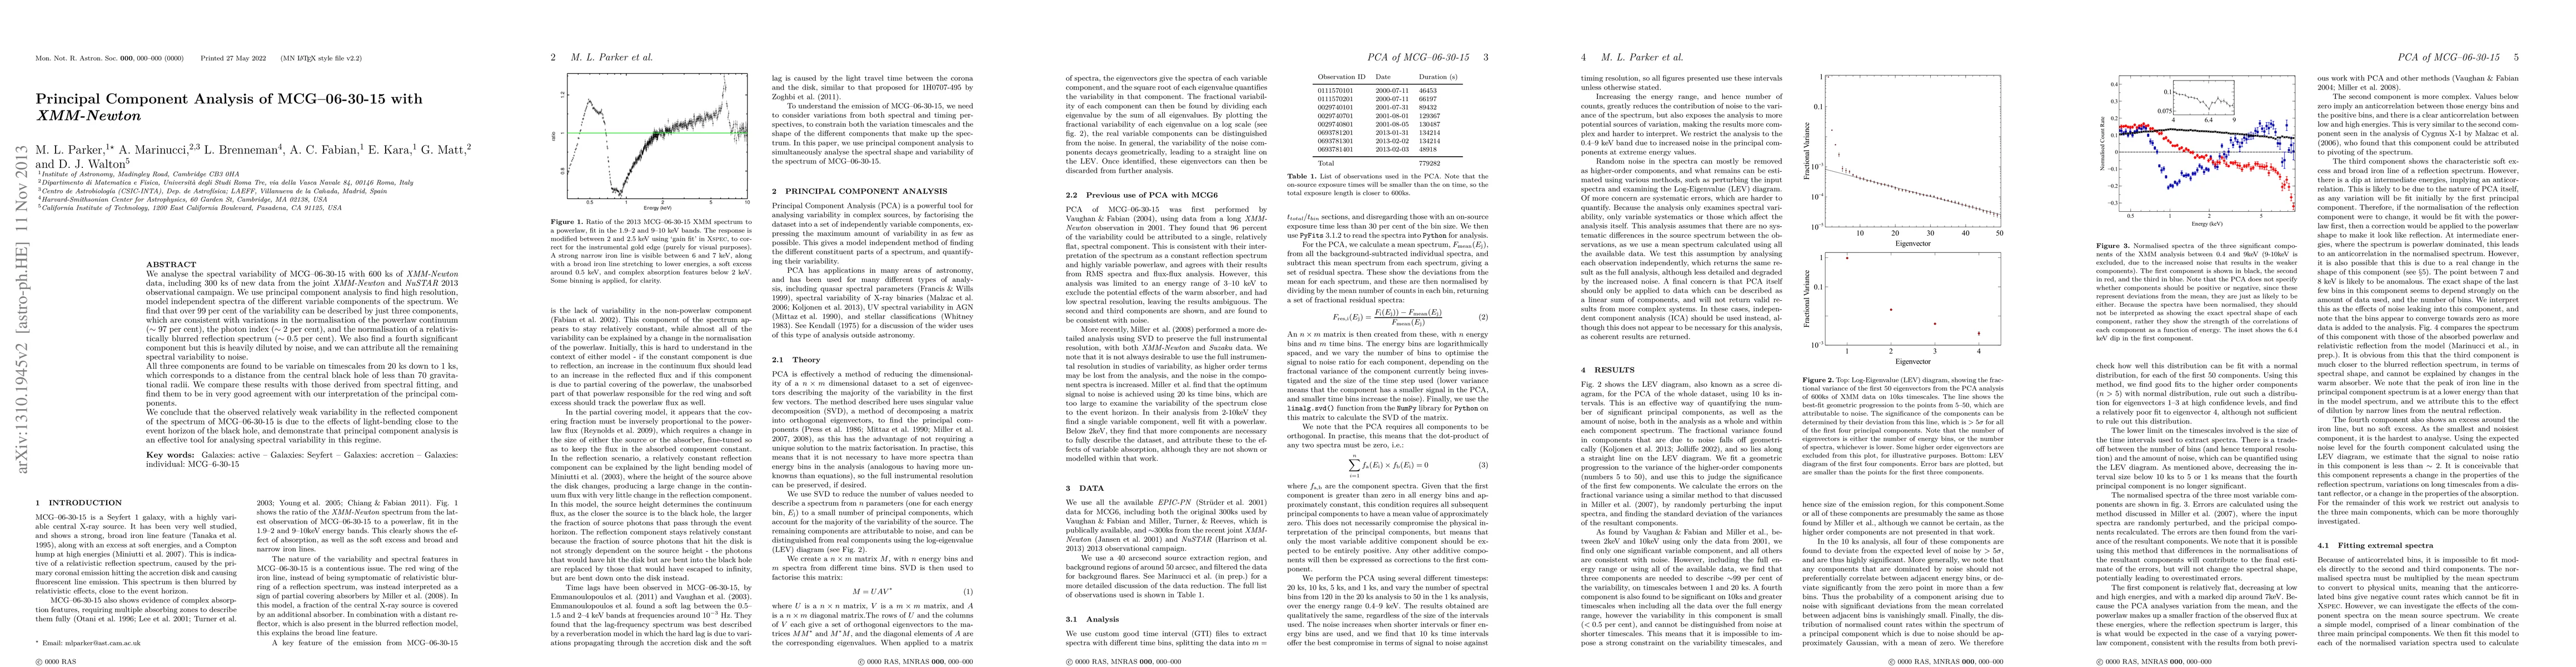
We analyse the spectral variability of MCG--06-30-15 with 600 ks of XMM-Newton data, including 300 ks of new data from the joint XMM-Newton and NuSTAR 2013 observational campaign. We use principal component analysis to find high resolution, model independent spectra of the different variable components of the spectrum. We find that over 99 per cent of the variability can be described by just three components, which are consistent with variations in the normalisation of the powerlaw continuum (~97 per cent), the photon index (~2 per cent), and the normalisation of a relativistically blurred reflection spectrum (~0.5 per cent). We also find a fourth significant component but this is heavily diluted by noise, and we can attribute all the remaining spectral variability to noise. All three components are found to be variable on timescales from 20 ks down to 1 ks, which corresponds to a distance from the central black hole of less than 70 gravitational radii. We compare these results with those derived from spectral fitting, and find them to be in very good agreement with our interpretation of the principal components. We conclude that the observed relatively weak variability in the reflected component of the spectrum of MCG--06-30-15 is due to the effects of light-bending close to the event horizon of the black hole, and demonstrate that principal component analysis is an effective tool for analysing spectral variability in this regime.
AI Key Findings
Get AI-generated insights about this paper's methodology, results, significance, and more — seven facets brought into focus.
Impact
Paper Details
PDF Preview
Key Terms
Citation Network
Current paper (gray), citations (green), references (blue)
Display is limited for performance on very large graphs.
Discussion 0