ArxivLens

Quick Summary:

This paper explores the integration of interactive exploratory data visualization in high-dimensional astronomical datasets, advocating for "linked view" systems that update multiple visualizations in real-time as researchers manipulate data. It suggests the development of open-source modular software to create flexible, evolving visualization environments for astrophysical research.

DOI: 10.1002/asna.201211705
arXiv Id: 1205.4747
Comments: 10 pages, 9 figures, expected to appear in Astron. Nachr. 333, No.5/6,505-514 (2012) Invited Plenary at 2011 Astronomische Gesellschaft, "Surveys and Simulations: The Real and the Virtual Universe"
Date Published: 2015-06-05
Date Updated: 2015-06-05

Key Terms (TF-IDF):

visualization (0.300)
high dimensional (0.244)
displays (0.239)
linked (0.237)
high dimensional (0.233)
linked (0.223)
views (0.202)
astronomy (0.200)
views (0.197)
astronomy (0.196)
view (0.184)
data sets (0.181)
view (0.180)
data sets (0.178)
open (0.155)
open (0.153)
data (0.144)
dimensional (0.142)
environment (0.141)
sets (0.141)
License: http://arxiv.org/licenses/nonexclusive-distrib/1.0/

Summary:

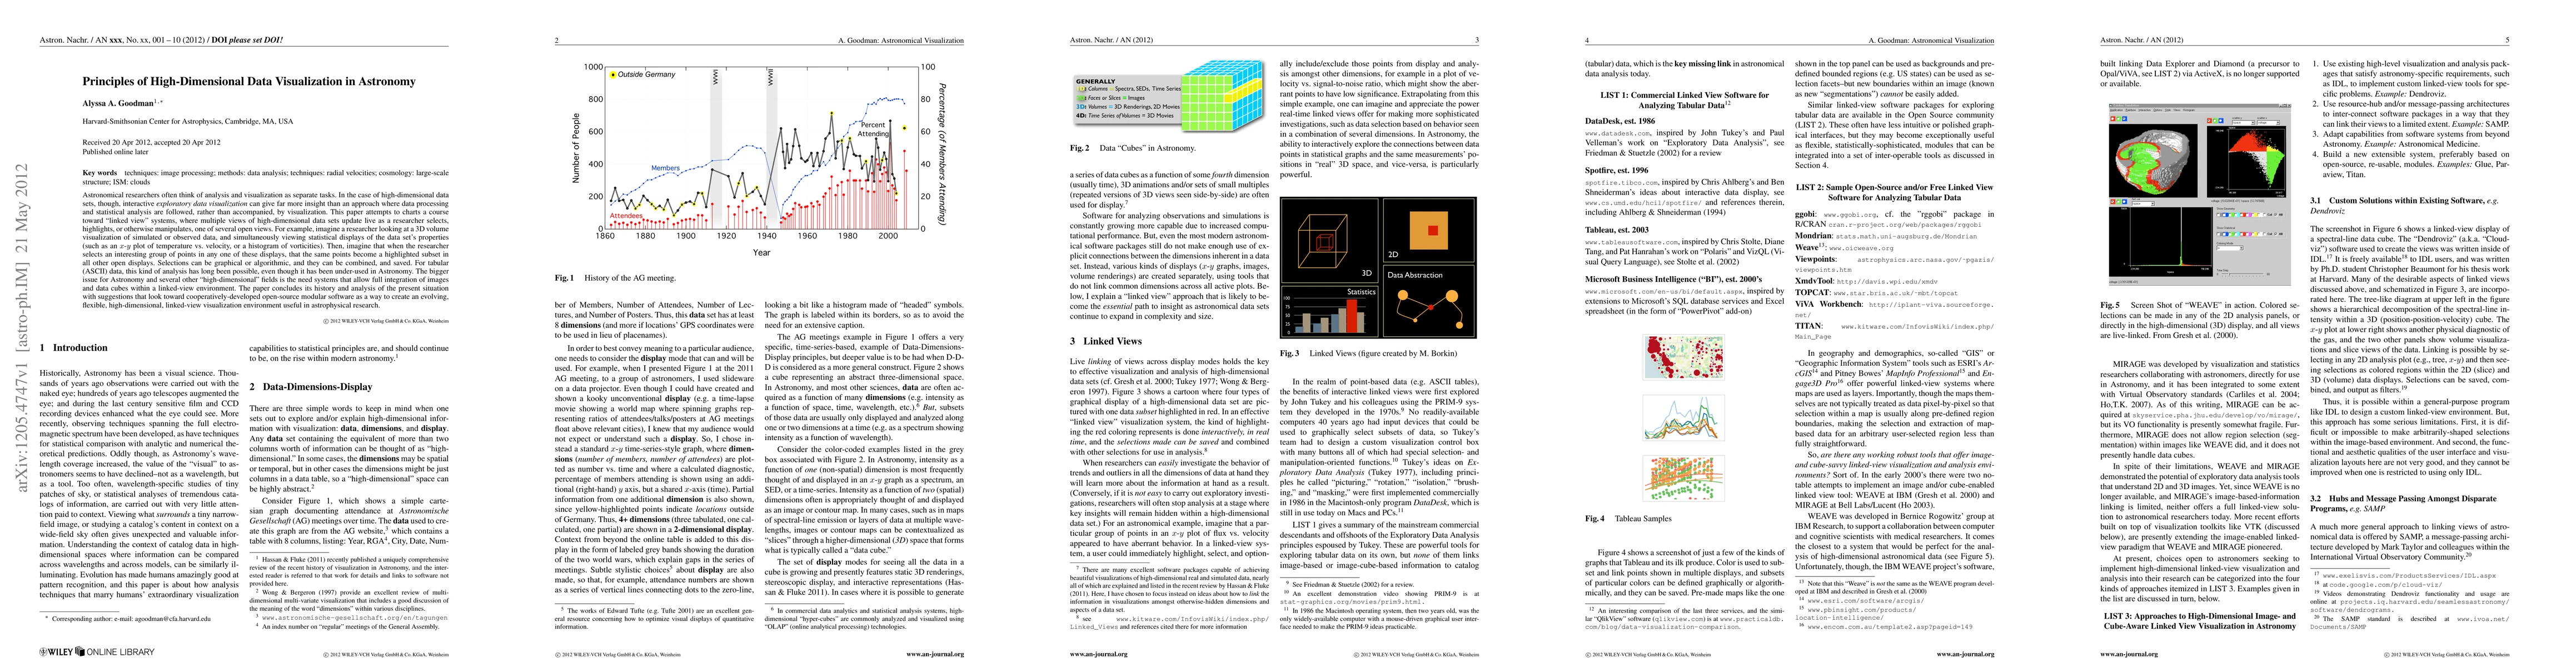
Astronomical researchers often think of analysis and visualization as separate tasks. In the case of high-dimensional data sets, though, interactive exploratory data visualization can give far more insight than an approach where data processing and statistical analysis are followed, rather than accompanied, by visualization. This paper attempts to charts a course toward "linked view" systems, where multiple views of high-dimensional data sets update live as a researcher selects, highlights, or otherwise manipulates, one of several open views. For example, imagine a researcher looking at a 3D volume visualization of simulated or observed data, and simultaneously viewing statistical displays of the data set's properties (such as an x-y plot of temperature vs. velocity, or a histogram of vorticities). Then, imagine that when the researcher selects an interesting group of points in any one of these displays, that the same points become a highlighted subset in all other open displays. Selections can be graphical or algorithmic, and they can be combined, and saved. For tabular (ASCII) data, this kind of analysis has long been possible, even though it has been under-used in Astronomy. The bigger issue for Astronomy and several other "high-dimensional" fields is the need systems that allow full integration of images and data cubes within a linked-view environment. The paper concludes its history and analysis of the present situation with suggestions that look toward cooperatively-developed open-source modular software as a way to create an evolving, flexible, high-dimensional, linked-view visualization environment useful in astrophysical research.

Citation & Reference Network Visualization

This graph shows how this paper is connected to other research. The current paper is shown in dark gray, papers that cite it are in green, and papers it references are in blue. You can:

Current Paper
Papers citing this work (Citations)
Papers cited by this work (References)

• Hover over any node to see the paper title

• Click a node to view that paper's details

• Drag nodes to rearrange the graph

• Use the zoom controls (bottom right) to zoom in/out

Citations and References

Title Authors Year Actions
Visual Evaluation for Autonomous Driving
Yijie Hou, Chengshun Wang, Junhong Wang, Xiangyang Xue, X. Zhang, Jun Zhu, Dongliang Wang, Siming Chen
2021
View Paper
Visualization in Astrophysics: Developing New Methods, Discovering Our Universe, and Educating the Earth
Fangfei Lan, Michael Young, Lauren Anderson, A. Ynnerman, A. Bock, M. Borkin, A. Forbes, J. Kollmeier, Bei Wang
2021
View Paper
Under-exploration of Three-Dimensional Images Leads to Search Errors for Small Salient Targets
M. Lago, Aditya Jonnalagadda, C. Abbey, B. Barufaldi, P. Bakic, Andrew D. A. Maidment, Winifred K Leung, S. Weinstein, B. Englander, M. Eckstein
2021
View Paper
Virtual Data Cosmos -- Information Design in Modern Astronomy
Annika Kreikenbohm
2021
View Paper
The Catalogue for Astrophysical Turbulence Simulations (CATS)
B. Burkhart, S. Appel, S. Bialy, Jungyeon Cho, A. J. Christensen, David C. Collins, C. Federrath, D. Fielding, D. Finkbeiner, Alex S. Hill, J. C. Ibáñez-Mejía, M. Krumholz, A. Lazarian, M. Li, P. Mocz, M. M. Low, J. Naiman, S. Portillo, B. Shane, Z. Slepian, Y. Yuan
2020
View Paper
Clustering-informed Cinematic Astrophysical Data Visualization with Application to the Moon-forming Terrestrial Synestia
P. Aleo, S. Lock, D. Cox, Stuart Levy, J. Naiman, A. Christensen, Kalina Borkiewicz, Robert Patterson
2020
View Paper
Using the Agile software development lifecycle to develop a standalone application for generating colour magnitude diagrams
Karol Fitzgerald, Lisa-Marie Browne, Ray F. Butler
2019
View Paper
Three-dimensional Radial Visualization of High-dimensional Continuous or Discrete Data
Fan Dai, Yifan Zhu, R. Maitra
2019
View Paper
Cinematic Visualization of Multiresolution Data: Ytini for Adaptive Mesh Refinement in Houdini
Kalina Borkiewicz, J. Naiman, Haoming Lai
2018
View Paper
New Thinking on, and with, Data Visualization
A. Goodman, M. Borkin, T. Robitaille
2018
View Paper
A browser-based tool for visualization and analysis of diffusion MRI data
J. Yeatman, Adam C. Richie-Halford, Josh K. Smith, A. Keshavan, Ariel S. Rokem
2018
View Paper
Topological study of diverse hydrogen-bonded patterns found in a system of a nickel(II) complex and the sulfate anion.
M. Harvey, S. Suarez, P. N. Zolotarev, D. Proserpio, R. Baggio
2018
View Paper
Vaex: big data exploration in the era of Gaia
M. Breddels, J. Veljanoski
2018
View Paper
Improving the usability of scientific software with participatory design: a new interface design for radio astronomy visualisation software
Laurisha Rampersad, Sarah Blyth, E. Elson, M. Kuttel
2017
View Paper
AFQ-Browser: Supporting reproducible human neuroscience research through browser-based visualization tools
J. Yeatman, Adam C. Richie-Halford, Josh K. Smith, A. Keshavan, Ariel S. Rokem
2017
View Paper
Gaia Data Release 1: The archive visualisation service
A. Moitinho, A. Krone-Martins, H. Savietto, M. Barros, C. Barata, A. Falcão, T. Fernandes, J. Alves, A. F. Silva, M. Gomes, J. Bakker, A. Brown, J. Gonz'alez-N'unez, G. Gracia-Abril, R. Guti'errez-S'anchez, J. Hern'andez, S. Jordan, X. Luri, B. Merín, F. Mignard, A. Mora, V. Navarro, W. O'Mullane, T. S. Sell'es, J. Salgado, J. Segovia, E. Utrilla, Frédéric Arenou, J. Bruijne, F. Jansen, M. McCaughrean, K. O'flaherty, M. B. Taylor, A. Vallenari
2017
View Paper
Real-time colouring and filtering with graphics shaders
D. Vohl, C. Fluke, D. Barnes, Amr H. Hassan
2017
View Paper
Statistical Methods in Astronomy
J. P. Long, R. S. Souza
2017
View Paper
TOPCAT: Desktop Exploration of Tabular Data for Astronomy and Beyond
Mark Taylor
2017
View Paper
The Green Bank Ammonia Survey: First Results of NH3 Mapping of the Gould Belt
R. Friesen, J. Pineda, E. Rosolowsky, F. Alves, A. Chac'on-Tanarro, H. Chen, M. Chen, J. di Francesco, J. Keown, H. Kirk, A. Punanova, Y. Seo, Y. Shirley, A. Ginsburg, C. Hall, S. Offner, Ayushi Singh, H. Arce, P. Caselli, A. Goodman, P. Martin, C. Matzner, P. Myers, E. Redaelli
2017
View Paper
SlicerAstro: A 3-D interactive visual analytics tool for HI data
D. Punzo, J. M. V. D. Hülst, J. Roerdink, J. Fillion-Robin, Lingyun Yu
2017
View Paper
LSSGalPy: Interactive Visualization of the Large-scale Environment Around Galaxies
M. Argudo-Fernández, S. Puertas, J. E. Ruiz, J. Sabater, S. Verley, G. Bergond
2017
View Paper
Houdini for Astrophysical Visualization
J. Naiman, Kalina Borkiewicz, A. Christensen
2017
View Paper
Voxel Datacubes for 3D Visualization in Blender
M. G'arate
2016
View Paper
Linking the X3D Pathway to Integral Field Spectrographs: YSNR 1E 0102.2-7219 in the SMC as a Case Study
F. Vogt, I. Seitenzahl, M. Dopita, A. Ruiter
2016
View Paper
AstroBlend: An astrophysical visualization package for Blender
J. Naiman
2016
View Paper
Cosmography of OB stars in the solar neighbourhood
H. Bouy, J. Alves
2015
View Paper
Geo-Coordinated Parallel Coordinates (GCPC): A Case Study of Environmental Data Analysis
Maha El Meseery, O. Hoeber
2015
View Paper
The role of 3-D interactive visualization in blind surveys of H i in galaxies
D. Punzo, J. M. V. D. Hülst, J. Roerdink, T. Oosterloo, M. Ramatsoku, M. Verheijen
2015
View Paper
Data Driven Discovery in Astrophysics
G. Longo, M. Brescia, S. Djorgovski, S. Cavuoti, C. Donalek
2014
View Paper
1. About the Book and Supporting Material
Alexander Gray, Ž. Ivezić, A. Connolly, J. Vanderplas
2014
View Paper
Visualization for the Physical Sciences
Dan R. Lipsa, R. Laramee, S. Cox, Jonathan C. Roberts, Rick Walker, M. Borkin, Hanspeter Pfister
2012
View Paper
Web Performance Evaluation of High Volume Streaming Data Visualization
Saiful Khan, Erik Rydow, Shahriar Etemaditajbakhsh, K. Adámek, W. Armour
2023
View Paper
Visualizing Four Dimensions in Special and General Relativity
Magdalena Kersting
2021
View Paper
PRINCETON SERIES IN MODERN OBSERVATIONAL ASTRONOMY
D. Spergel
2020
View Paper
Surveys, Catalogues, Databases, and Archives of Astronomical Data
I. Vavilova, L. Pakuliak, I. Babyk, A. Elyiv, D. Dobrycheva, O. V. Melnyk
2020
View Paper
Bibliographie
Christine L. Borgman
2020
View Paper
High-Dimensional Data Visualization
M. Nielsen
2017
View Paper
Multidimensional Data Exploration with Glue
Christopher Beaumont, T. Robitaille, A. Goodman, M. Borkin
2013
View Paper
Designing for Semi-formal Programming with Foundation Models
Sarah E. Chasins, Elena Glassman, Joshua Sunshine, . JoshPollock, . IanArawjo, . CarolineBerger, . ArvindSatyanarayan
View Paper

Comments (0)

This website uses cookies to ensure you get the best experience. Learn more