Publication
Metrics
AI Quick Summary
This method combines local models of system variables into a single graphical model, naturally incorporating domain knowledge and dependencies.
Paper Preview
Abstract
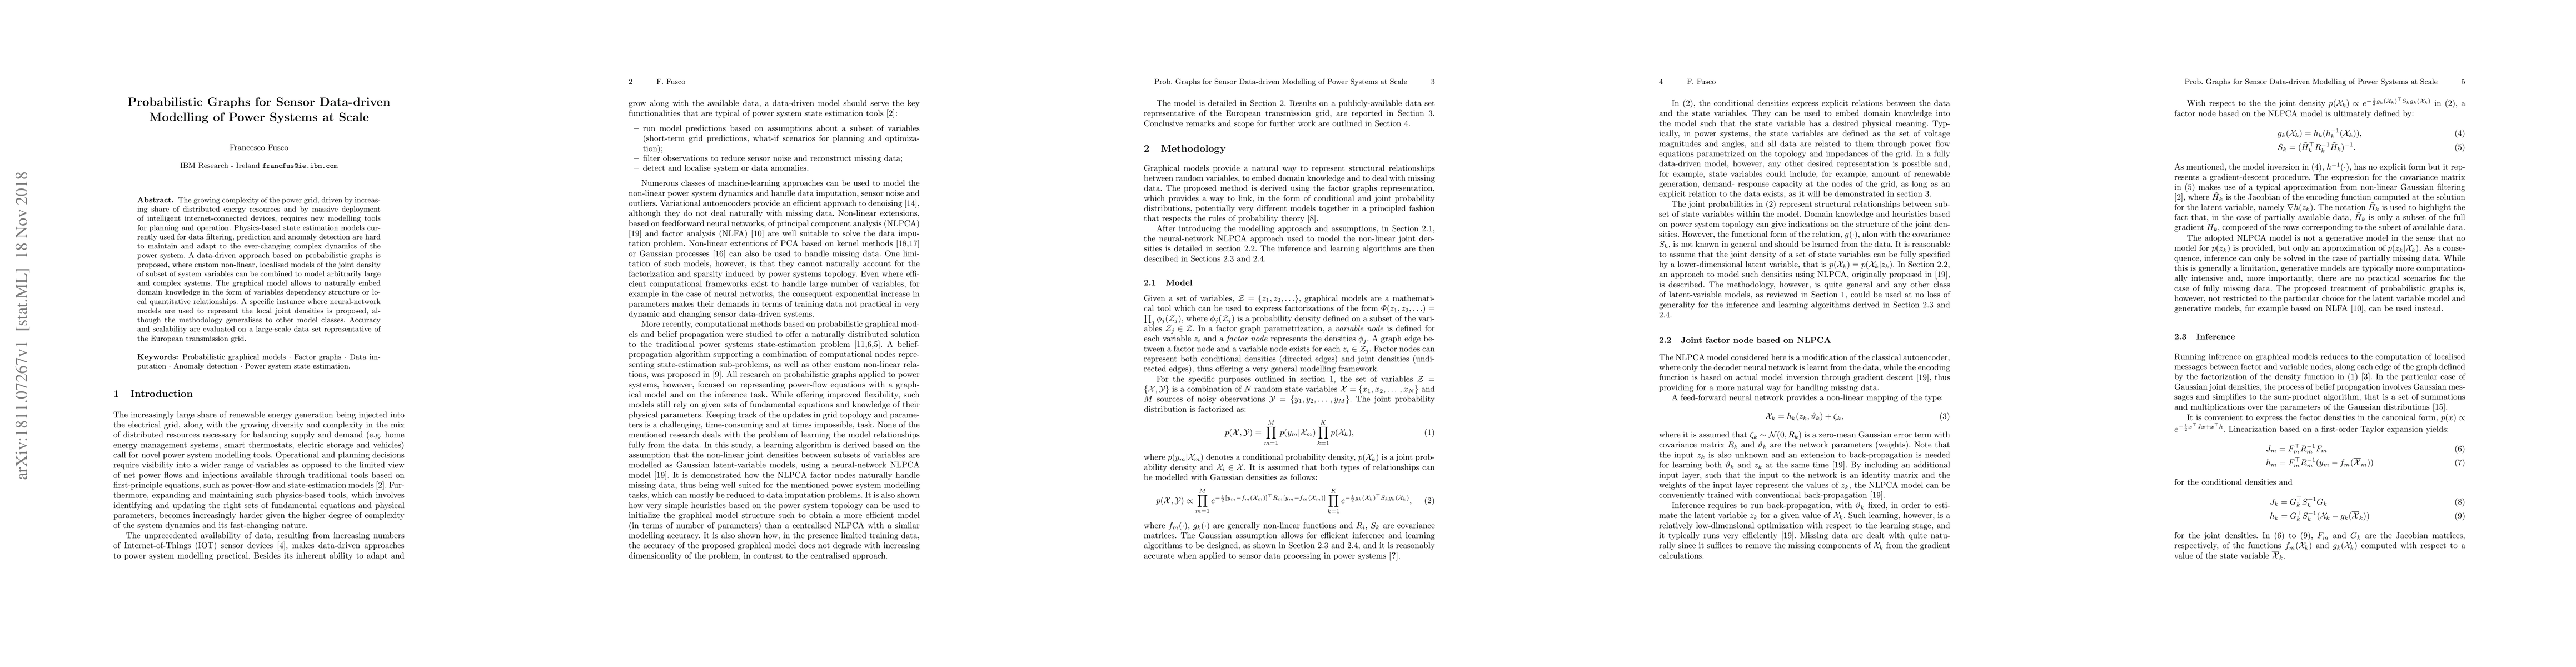
The growing complexity of the power grid, driven by increasing share of distributed energy resources and by massive deployment of intelligent internet-connected devices, requires new modelling tools for planning and operation. Physics-based state estimation models currently used for data filtering, prediction and anomaly detection are hard to maintain and adapt to the ever-changing complex dynamics of the power system. A data-driven approach based on probabilistic graphs is proposed, where custom non-linear, localised models of the joint density of subset of system variables can be combined to model arbitrarily large and complex systems. The graphical model allows to naturally embed domain knowledge in the form of variables dependency structure or local quantitative relationships. A specific instance where neural-network models are used to represent the local joint densities is proposed, although the methodology generalises to other model classes. Accuracy and scalability are evaluated on a large-scale data set representative of the European transmission grid.
AI Key Findings
Get AI-generated insights about this paper's methodology, results, significance, and more — seven facets brought into focus.
Impact
Paper Details
PDF Preview
Key Terms
Citation Network
Current paper (gray), citations (green), references (blue)
Display is limited for performance on very large graphs.
Discussion 0