Probing neural networks with t-SNE, class-specific projections and a guided tour
Publication
Metrics
Paper Preview
Abstract
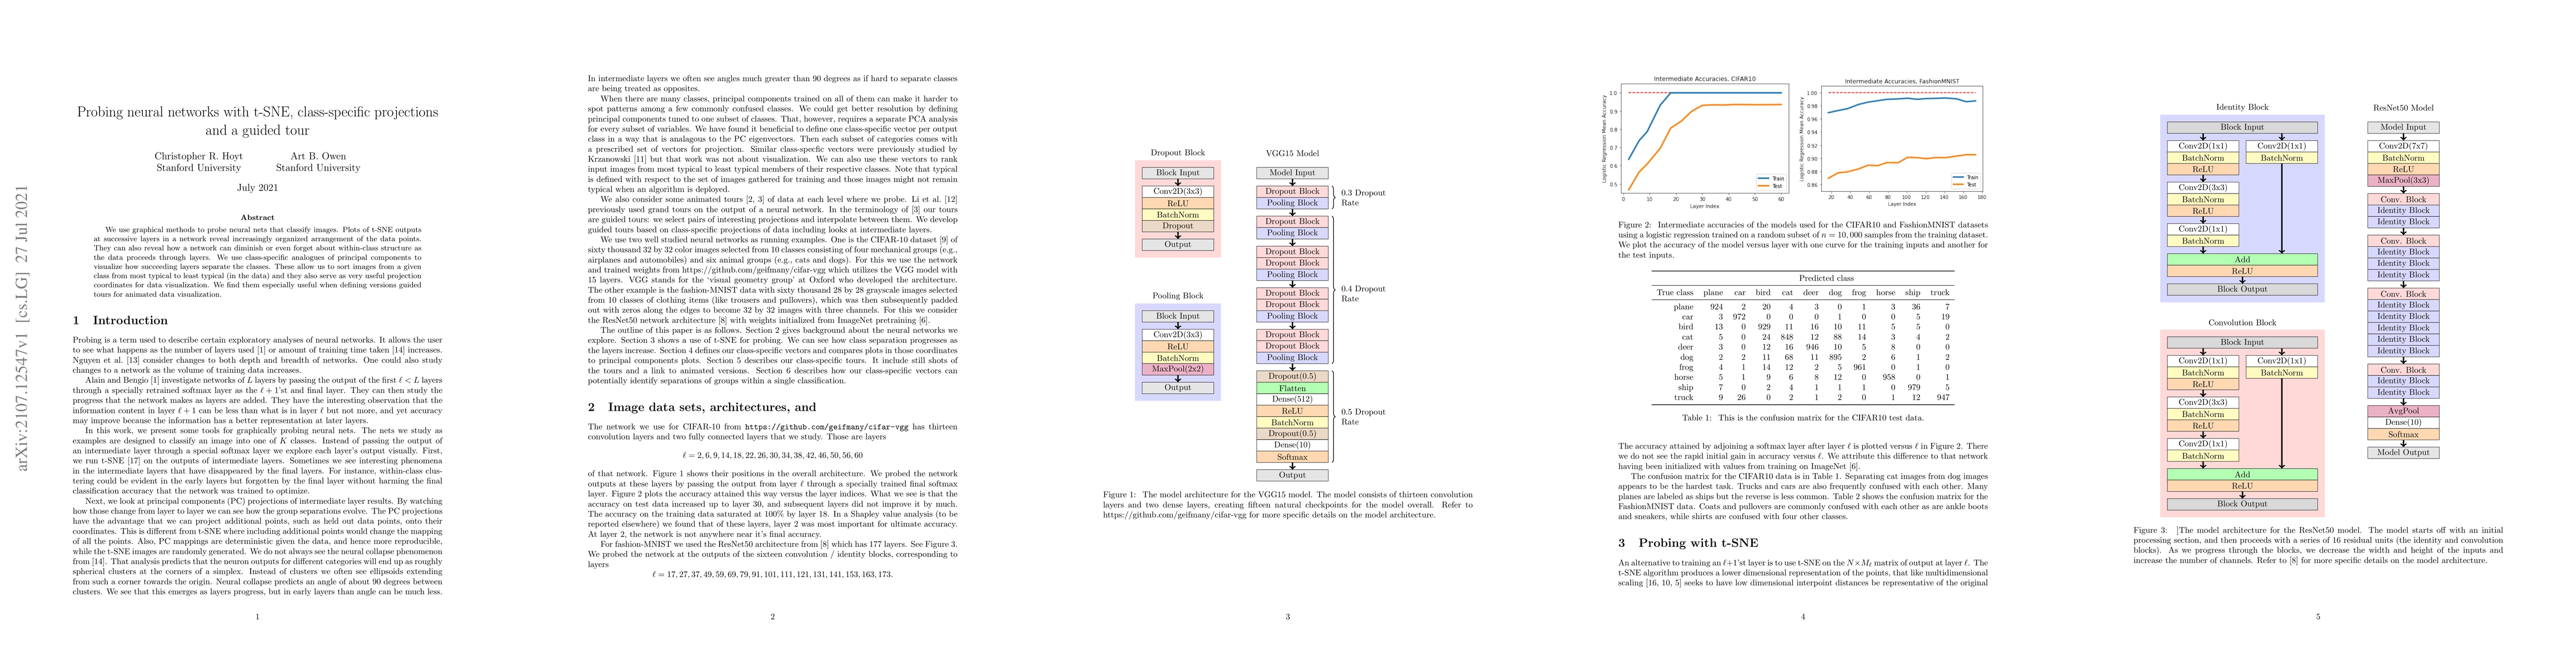
We use graphical methods to probe neural nets that classify images. Plots of t-SNE outputs at successive layers in a network reveal increasingly organized arrangement of the data points. They can also reveal how a network can diminish or even forget about within-class structure as the data proceeds through layers. We use class-specific analogues of principal components to visualize how succeeding layers separate the classes. These allow us to sort images from a given class from most typical to least typical (in the data) and they also serve as very useful projection coordinates for data visualization. We find them especially useful when defining versions guided tours for animated data visualization.
AI Key Findings
Get AI-generated insights about this paper's methodology, results, significance, and more — seven facets brought into focus.
Impact
Paper Details
Authors
PDF Preview
Key Terms
Citation Network
Current paper (gray), citations (green), references (blue)
Display is limited for performance on very large graphs.
Discussion 0