Summary
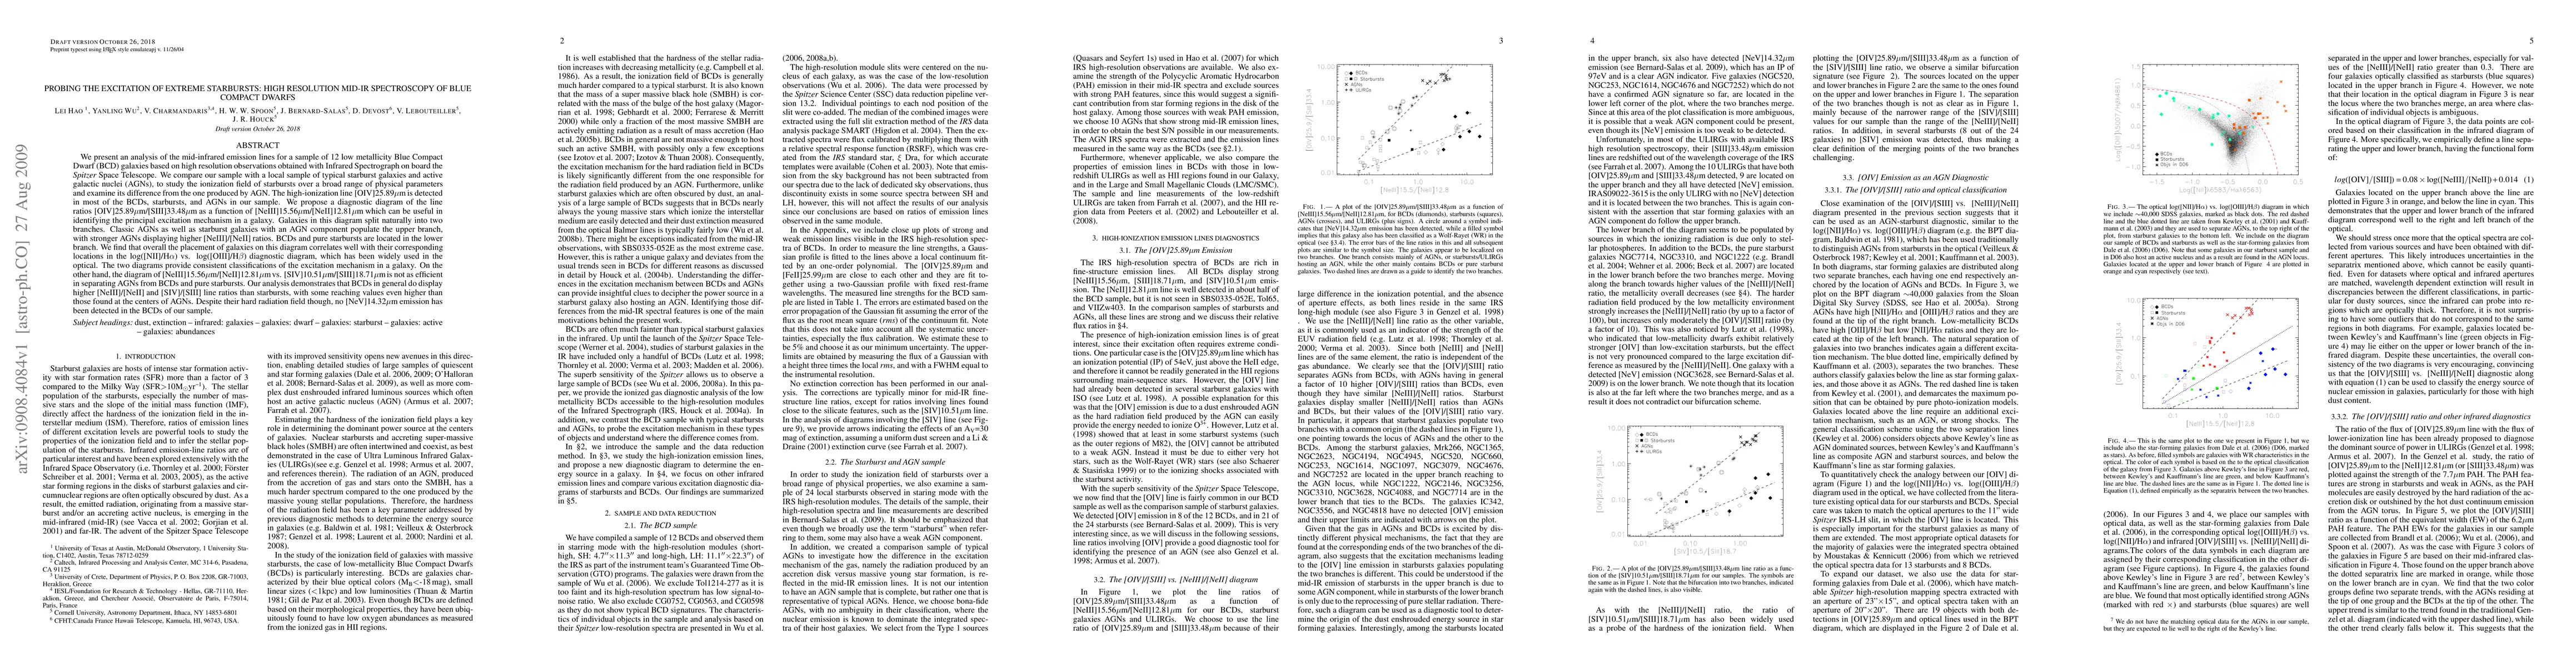
We present an analysis of the mid-infrared emission lines for a sample of 12 low metallicity Blue Compact Dwarf (BCD) galaxies based on high resolution observations obtained with Infrared Spectrograph on board the {\rm Spitzer} Space Telescope. We compare our sample with a local sample of typical starburst galaxies and active galactic nuclei (AGNs), to study the ionization field of starbursts over a broad range of physical parameters and examine its difference from the one produced by AGN. The high-ionization line [OIV]25.89$\mu$m is detected in most of the BCDs, starbursts, and AGNs in our sample. We propose a diagnostic diagram of the line ratios [OIV]25.89$\mu$m/[SIII]33.48$\mu$m as a function of [NeIII]15.56$\mu$m/[NeII]12.81$\mu$m which can be useful in identifying the principal excitation mechanism in a galaxy. Galaxies in this diagram split naturally into two branches. Classic AGNs as well as starburst galaxies with an AGN component populate the upper branch, with stronger AGNs displaying higher [NeIII]/[NeII] ratios. BCDs and pure starbursts are located in the lower branch. We find that overall the placement of galaxies on this diagram correlates well with their corresponding locations in the log([NII]/H$\alpha$) vs. log([OIII]/H$\beta$) diagnostic diagram, which has been widely used in the optical. The two diagrams provide consistent classifications of the excitation mechanism in a galaxy. On the other hand, the diagram of [NeIII]15.56$\mu$m/[NeII]12.81$\mu$m vs. [SIV]10.51$\mu$m/[SIII]18.71$\mu$m is not as efficient in separating AGNs from BCDs and pure starbursts. (abridged)
AI Key Findings
Get AI-generated insights about this paper's methodology, results, and significance.
Paper Details
PDF Preview
Key Terms
Citation Network
Current paper (gray), citations (green), references (blue)
Display is limited for performance on very large graphs.
Similar Papers
Found 4 papers| Title | Authors | Year | Actions |
|---|
Comments (0)