Authors
Summary
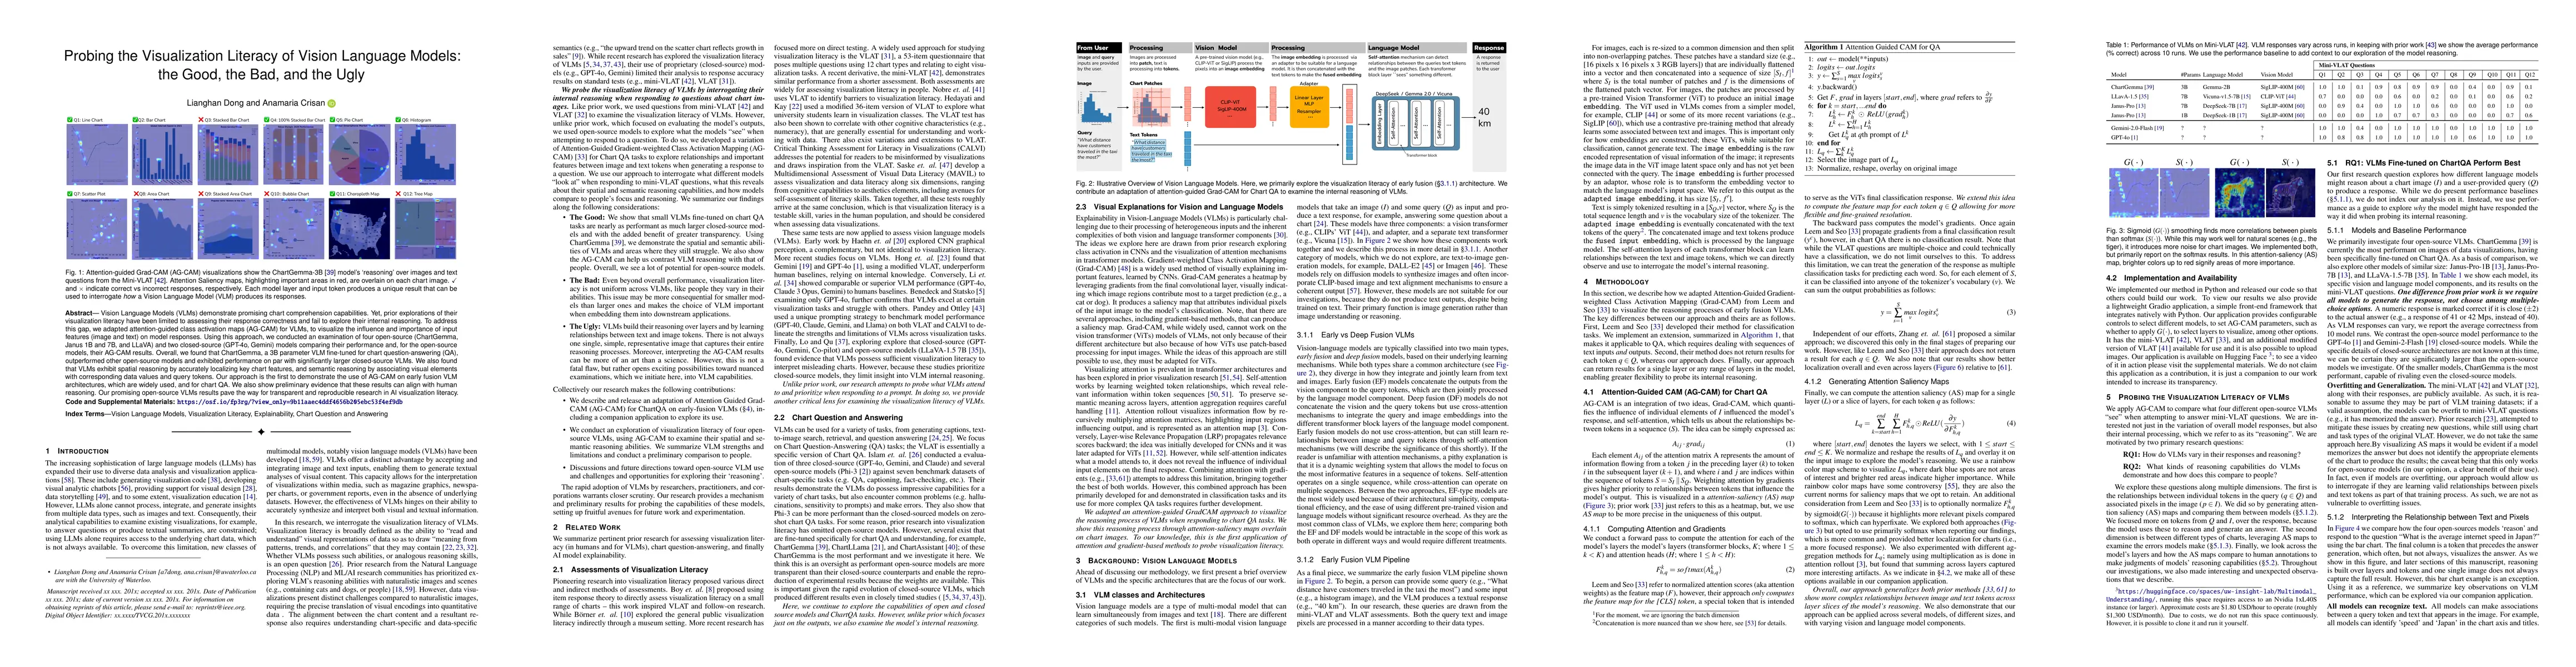
Vision Language Models (VLMs) demonstrate promising chart comprehension capabilities. Yet, prior explorations of their visualization literacy have been limited to assessing their response correctness and fail to explore their internal reasoning. To address this gap, we adapted attention-guided class activation maps (AG-CAM) for VLMs, to visualize the influence and importance of input features (image and text) on model responses. Using this approach, we conducted an examination of four open-source (ChartGemma, Janus 1B and 7B, and LLaVA) and two closed-source (GPT-4o, Gemini) models comparing their performance and, for the open-source models, their AG-CAM results. Overall, we found that ChartGemma, a 3B parameter VLM fine-tuned for chart question-answering (QA), outperformed other open-source models and exhibited performance on par with significantly larger closed-source VLMs. We also found that VLMs exhibit spatial reasoning by accurately localizing key chart features, and semantic reasoning by associating visual elements with corresponding data values and query tokens. Our approach is the first to demonstrate the use of AG-CAM on early fusion VLM architectures, which are widely used, and for chart QA. We also show preliminary evidence that these results can align with human reasoning. Our promising open-source VLMs results pave the way for transparent and reproducible research in AI visualization literacy.
AI Key Findings
Generated Jun 10, 2025
Methodology
The paper adapted Attention-Guided Gradient-weighted Class Activation Mapping (AG-CAM) to visualize the internal reasoning processes of early fusion Vision Language Models (VLMs) for chart question-answering (QA). AG-CAM was applied to four open-source models (ChartGemma, Janus 1B and 7B, LLaVA) and two closed-source models (GPT-4o, Gemini).
Key Results
- ChartGemma, a 3B parameter VLM fine-tuned for chart QA, outperformed other open-source models and matched the performance of larger closed-source VLMs.
- VLMs demonstrated spatial reasoning by accurately localizing key chart features and semantic reasoning by associating visual elements with corresponding data values and query tokens.
- AG-CAM was successfully applied to early fusion VLM architectures for chart QA, marking the first use of this approach on such models.
- Preliminary evidence suggests alignment of VLM reasoning with human reasoning.
- Open-source VLM results pave the way for transparent and reproducible research in AI visualization literacy.
Significance
This research is significant as it goes beyond assessing the correctness of VLM responses to chart-related questions, delving into their internal reasoning processes. It highlights the capabilities of smaller, open-source models like ChartGemma, which can rival larger closed-source models in visualization literacy tasks.
Technical Contribution
The paper introduces the application of AG-CAM to early fusion VLMs for chart QA, providing a novel method to visualize and understand model internal reasoning.
Novelty
The research distinguishes itself by focusing on the internal reasoning of VLMs, employing AG-CAM for visualization, and emphasizing the performance of open-source models, which has not been extensively explored in prior work.
Limitations
- The study primarily focused on open-source models, so generalizability to all VLMs might be limited.
- The methodology was adapted for chart QA tasks, so its applicability to other visualization literacy tasks remains to be explored.
Future Work
- Explore the application of AG-CAM on other VLM architectures and tasks beyond chart QA.
- Investigate the scalability of visualization literacy in even larger VLMs.
- Develop more comprehensive evaluation metrics that capture nuances of real-world chart understanding.
Paper Details
PDF Preview
Citation Network
Current paper (gray), citations (green), references (blue)
Display is limited for performance on very large graphs.
Similar Papers
Found 4 papersNeural topology optimization: the good, the bad, and the ugly
Miguel A. Bessa, Suryanarayanan Manoj Sanu, Alejandro M. Aragon
No citations found for this paper.
Comments (0)