Programmable Event Detection for In-Band Network Telemetry
Publication
Metrics
AI Quick Summary
Researchers developed a programmable event detection mechanism in P4 that reduces network overhead and stream processor load by pre-filtering telemetry reports in the switch data plane, increasing capacity by 10-15x.
Paper Preview
Abstract
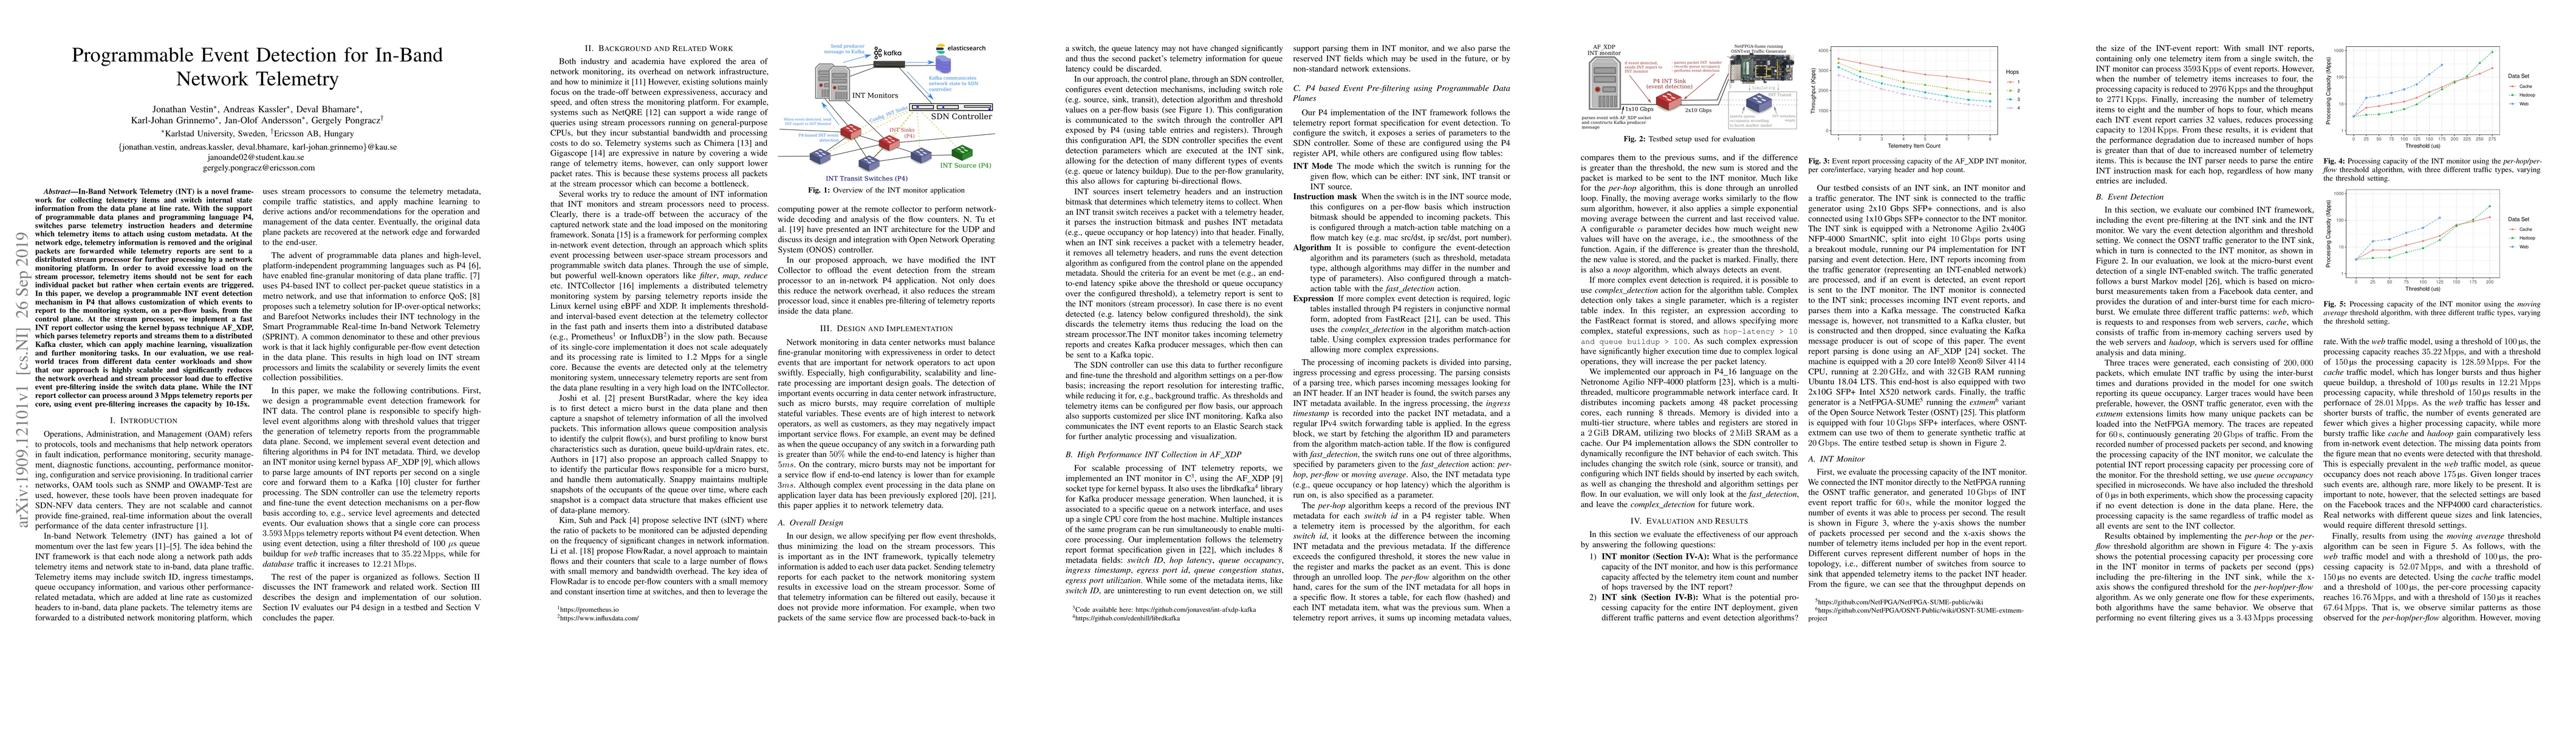
In-Band Network Telemetry (INT) is a novel framework for collecting telemetry items and switch internal state information from the data plane at line rate. With the support of programmable data planes and programming language P4, switches parse telemetry instruction headers and determine which telemetry items to attach using custom metadata. At the network edge, telemetry information is removed and the original packets are forwarded while telemetry reports are sent to a distributed stream processor for further processing by a network monitoring platform. In order to avoid excessive load on the stream processor, telemetry items should not be sent for each individual packet but rather when certain events are triggered. In this paper, we develop a programmable INT event detection mechanism in P4 that allows customization of which events to report to the monitoring system, on a per-flow basis, from the control plane. At the stream processor, we implement a fast INT report collector using the kernel bypass technique AF_XDP, which parses telemetry reports and streams them to a distributed Kafka cluster, which can apply machine learning, visualization and further monitoring tasks. In our evaluation, we use real-world traces from different data center workloads and show that our approach is highly scalable and significantly reduces the network overhead and stream processor load due to effective event pre-filtering inside the switch data plane. While the INT report collector can process around 3 Mpps telemetry reports per core, using event pre-filtering increases the capacity by 10-15x.
AI Key Findings
Get AI-generated insights about this paper's methodology, results, significance, and more — seven facets brought into focus.
Impact
Paper Details
Authors
PDF Preview
Key Terms
Citation Network
Current paper (gray), citations (green), references (blue)
Display is limited for performance on very large graphs.
Discussion 0