Summary
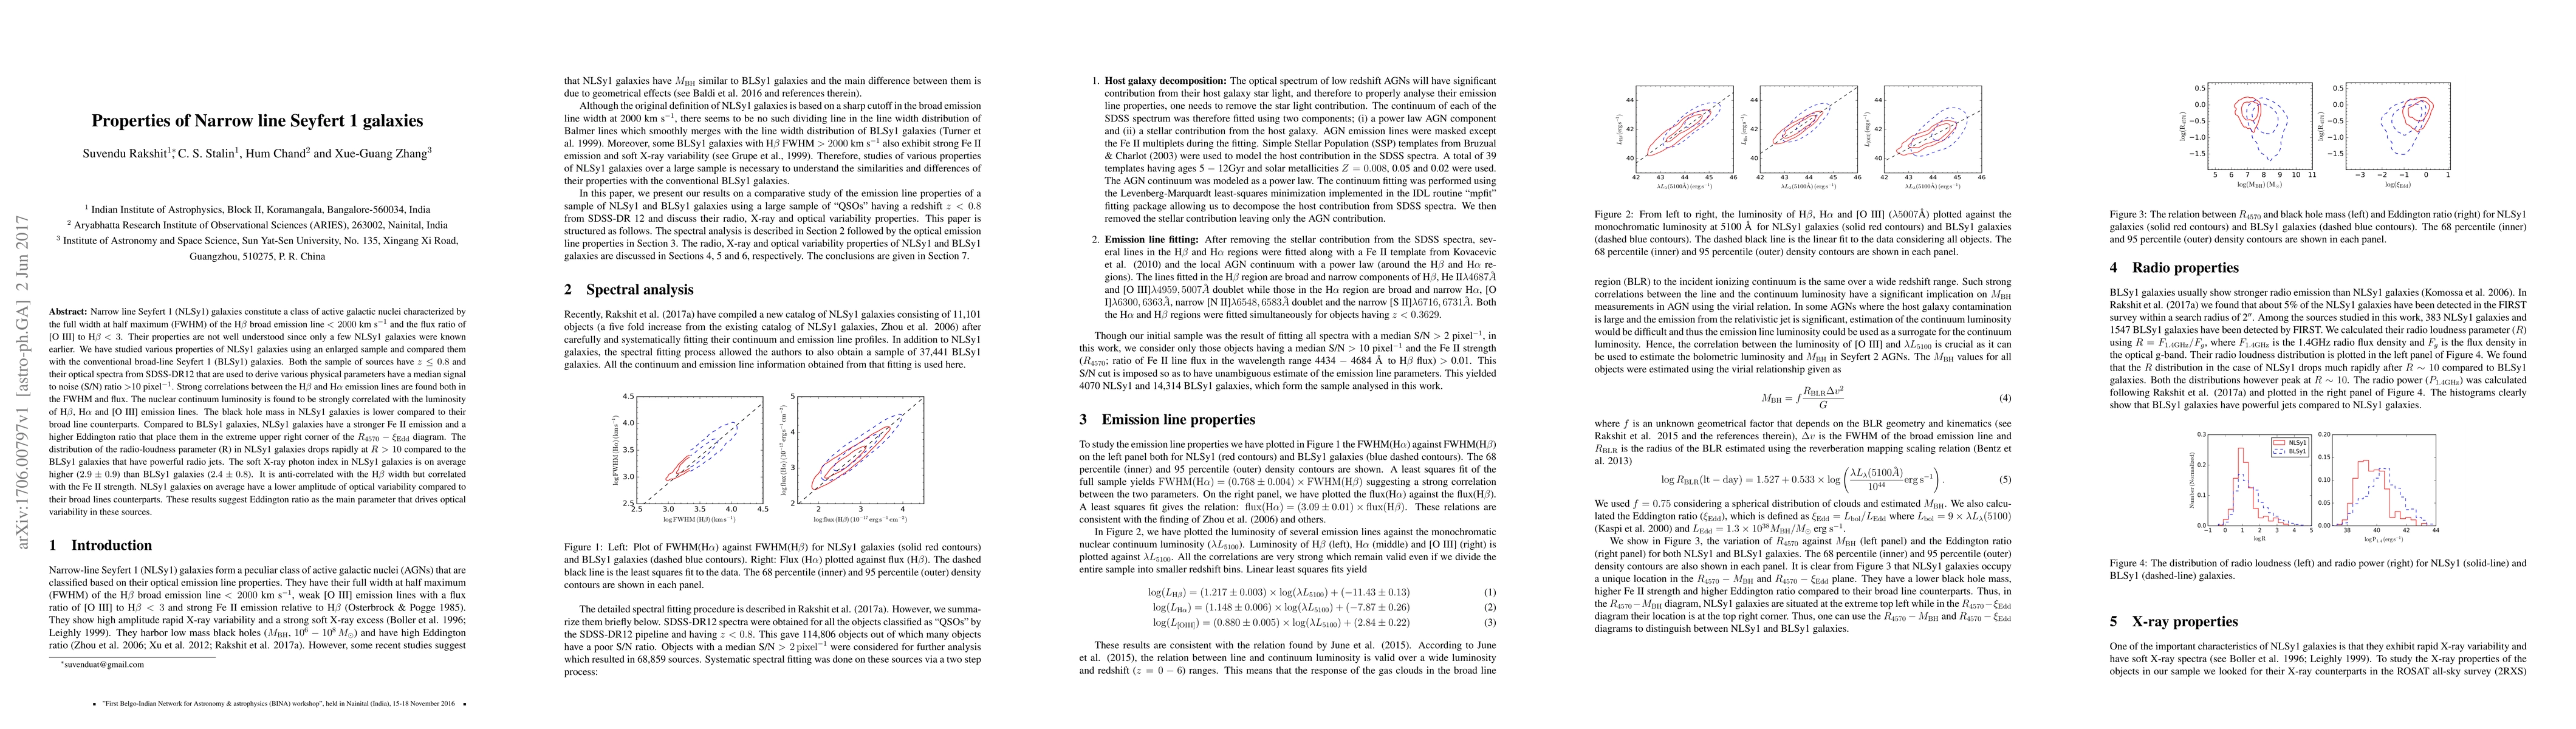
Narrow line Seyfert 1 (NLSy1) galaxies constitute a class of active galactic nuclei characterized by the full width at half maximum (FWHM) of the H$\beta$ broad emission line < 2000 km/s and the flux ratio of [O III] to H$\beta$ < 3. Their properties are not well understood since only a few NLSy1 galaxies were known earlier. We have studied various properties of NLSy1 galaxies using an enlarged sample and compared them with the conventional broad-line Seyfert 1 (BLSy1) galaxies. Both the sample of sources have z $\le$ 0.8 and their optical spectra from SDSS-DR12 that are used to derive various physical parameters have a median signal to noise (S/N) ratio >10 per pixel. Strong correlations between the H$\beta$ and H$\alpha$ emission lines are found both in the FWHM and flux. The nuclear continuum luminosity is found to be strongly correlated with the luminosity of H$\beta$, H$\alpha$ and [O III] emission lines. The black hole mass in NLSy1 galaxies is lower compared to their broad line counterparts. Compared to BLSy1 galaxies, NLSy1 galaxies have a stronger FeII emission and a higher Eddington ratio that place them in the extreme upper right corner of the $R_{4570}$ - $\xi_{Edd}$ diagram. The distribution of the radio-loudness parameter (R) in NLSy1 galaxies drops rapidly at R > 10 compared to the BLSy1 galaxies that have powerful radio jets. The soft X-ray photon index in NLSy1 galaxies is on average higher (2.9 $\pm$ 0.9) than BLSy1 galaxies (2.4 $\pm$ 0.8). It is anti-correlated with the H$\beta$ width but correlated with the Fe II strength. NLSy1 galaxies on average have a lower amplitude of optical variability compared to their broad lines counterparts. These results suggest Eddington ratio as the main parameter that drives optical variability in these sources.
AI Key Findings
Get AI-generated insights about this paper's methodology, results, and significance.
Paper Details
PDF Preview
Key Terms
Citation Network
Current paper (gray), citations (green), references (blue)
Display is limited for performance on very large graphs.
Similar Papers
Found 4 papers| Title | Authors | Year | Actions |
|---|
Comments (0)