Proximity Alert: Ipelets for Neighborhood Graphs and Clustering
Publication
Metrics
Paper Preview
Abstract
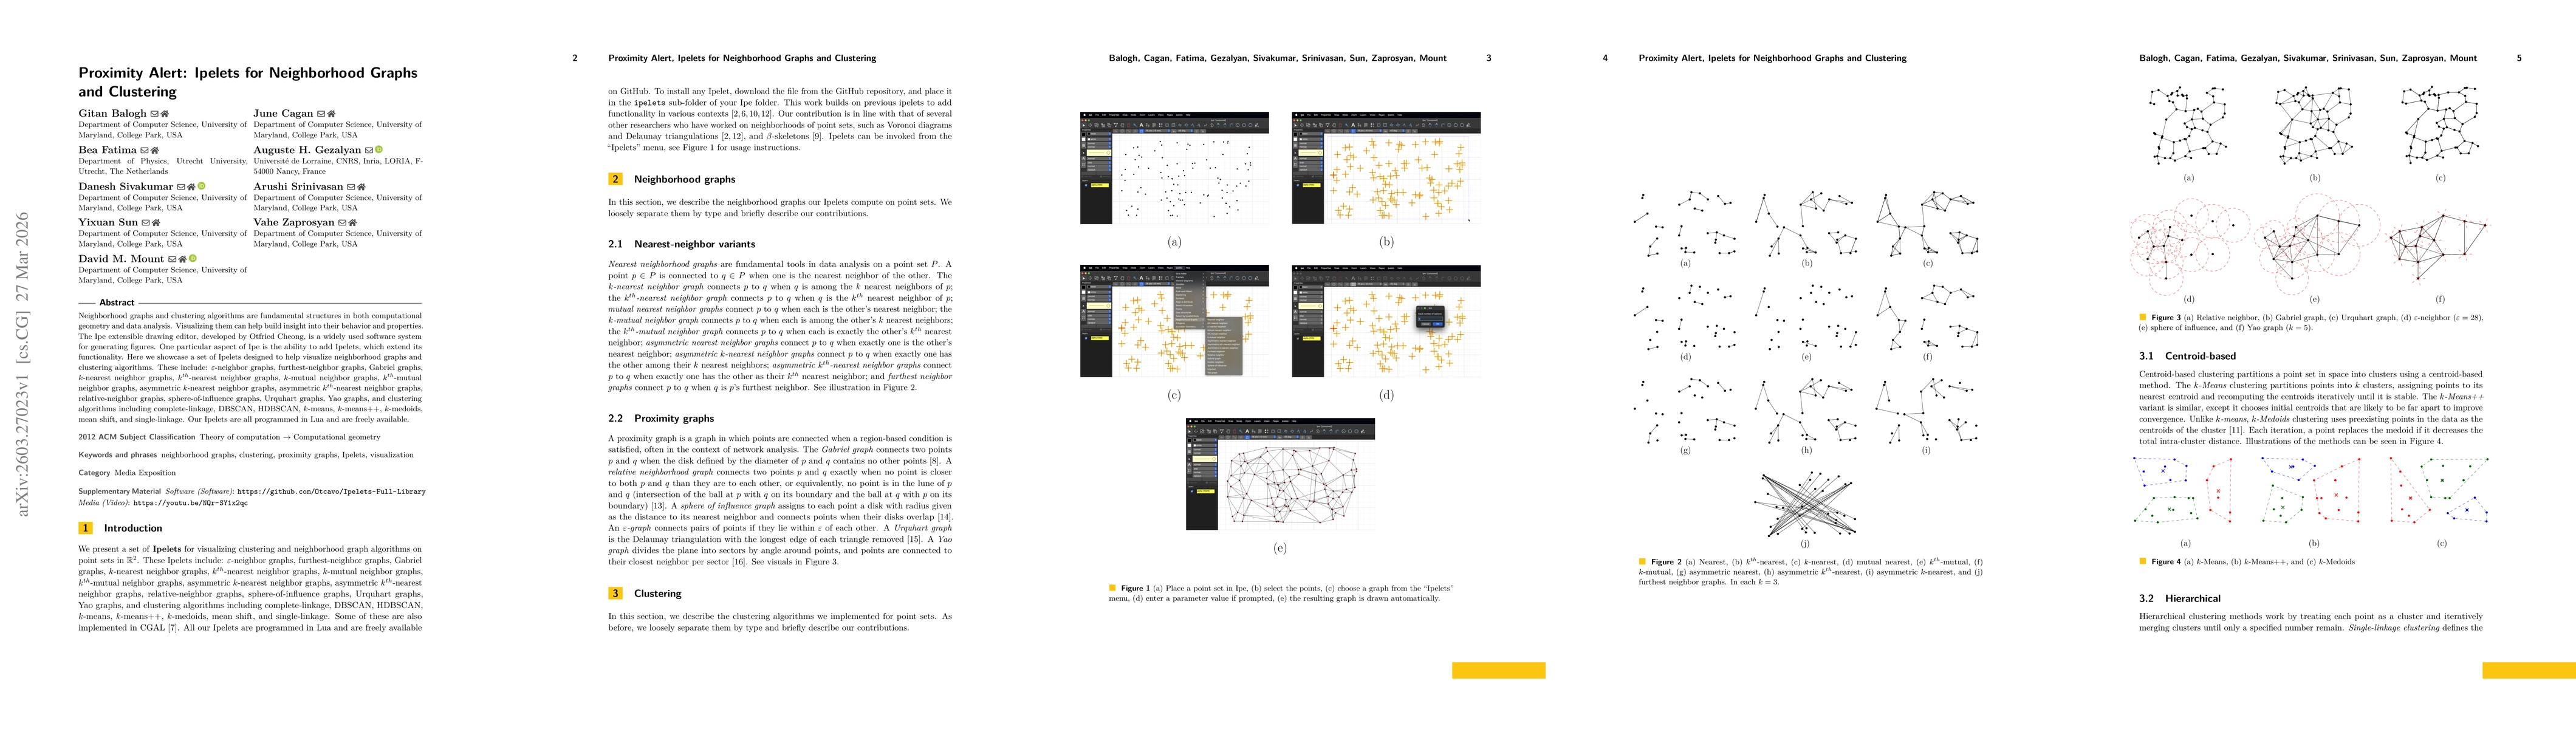
Neighborhood graphs and clustering algorithms are fundamental structures in both computational geometry and data analysis. Visualizing them can help build insight into their behavior and properties. The Ipe extensible drawing editor, developed by Otfried Cheong, is a widely used software system for generating figures. One particular aspect of Ipe is the ability to add Ipelets, which extend its functionality. Here we showcase a set of Ipelets designed to help visualize neighborhood graphs and clustering algorithms. These include: $\eps$-neighbor graphs, furthest-neighbor graphs, Gabriel graphs, $k$-nearest neighbor graphs, $k^{th}$-nearest neighbor graphs, $k$-mutual neighbor graphs, $k^{th}$-mutual neighbor graphs, asymmetric $k$-nearest neighbor graphs, asymmetric $k^{th}$-nearest neighbor graphs, relative-neighbor graphs, sphere-of-influence graphs, Urquhart graphs, Yao graphs, and clustering algorithms including complete-linkage, DBSCAN, HDBSCAN, $k$-means, $k$-means++, $k$-medoids, mean shift, and single-linkage. Our Ipelets are all programmed in Lua and are freely available.
AI Key Findings
Get AI-generated insights about this paper's methodology, results, significance, and more — seven facets brought into focus.
Discussion 0