Publication
Metrics
AI Quick Summary
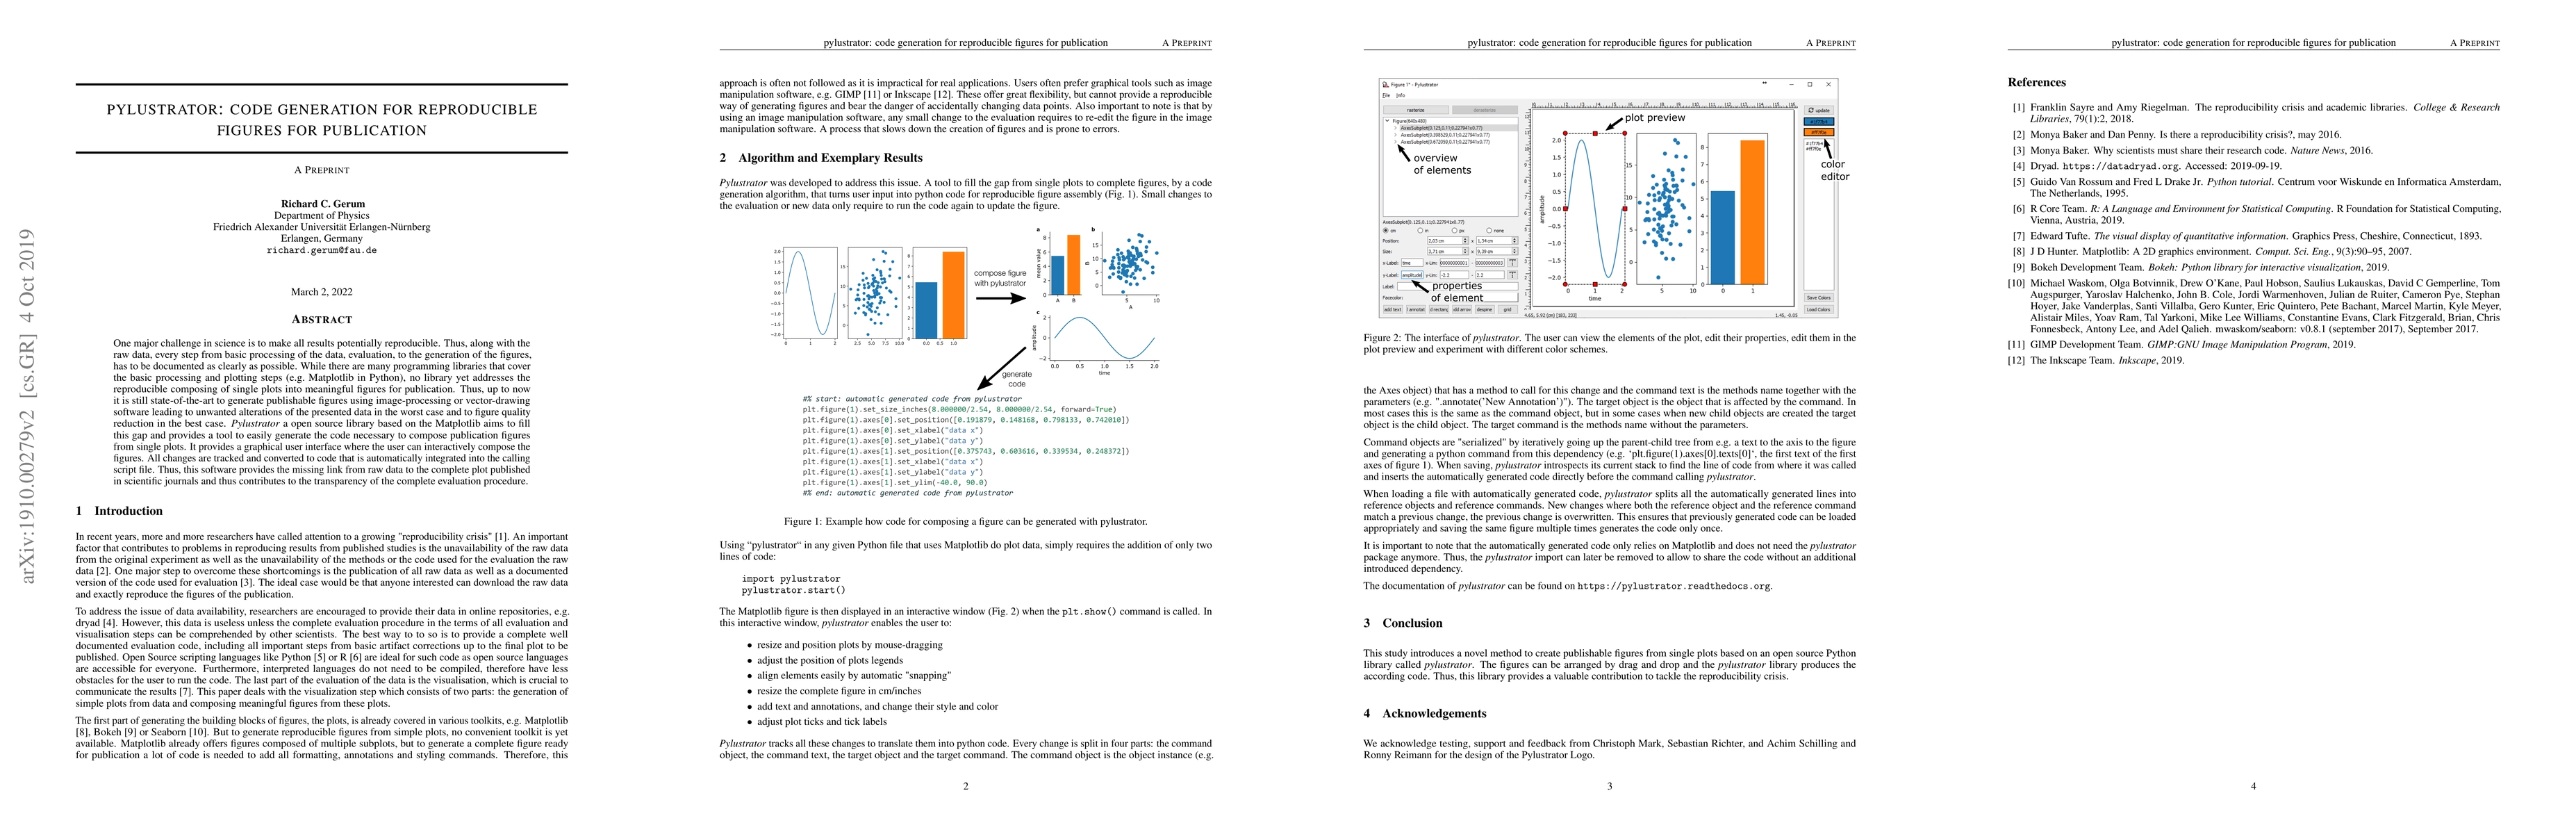
Pylustrator is an open-source library that generates code for reproducible figures in scientific publications, filling the gap between raw data and publication-ready plots.
Paper Preview
Abstract
One major challenge in science is to make all results potentially reproducible. Thus, along with the raw data, every step from basic processing of the data, evaluation, to the generation of the figures, has to be documented as clearly as possible. While there are many programming libraries that cover the basic processing and plotting steps (e.g. Matplotlib in Python), no library yet addresses the reproducible composing of single plots into meaningful figures for publication. Thus, up to now it is still state-of-the-art to generate publishable figures using image-processing or vector-drawing software leading to unwanted alterations of the presented data in the worst case and to figure quality reduction in the best case. Pylustrator a open source library based on the Matplotlib aims to fill this gap and provides a tool to easily generate the code necessary to compose publication figures from single plots. It provides a graphical user interface where the user can interactively compose the figures. All changes are tracked and converted to code that is automatically integrated into the calling script file. Thus, this software provides the missing link from raw data to the complete plot published in scientific journals and thus contributes to the transparency of the complete evaluation procedure.
AI Key Findings
Get AI-generated insights about this paper's methodology, results, significance, and more — seven facets brought into focus.
Impact
Paper Details
Authors
PDF Preview
Key Terms
Citation Network
Current paper (gray), citations (green), references (blue)
Display is limited for performance on very large graphs.
Discussion 0