Authors
Summary
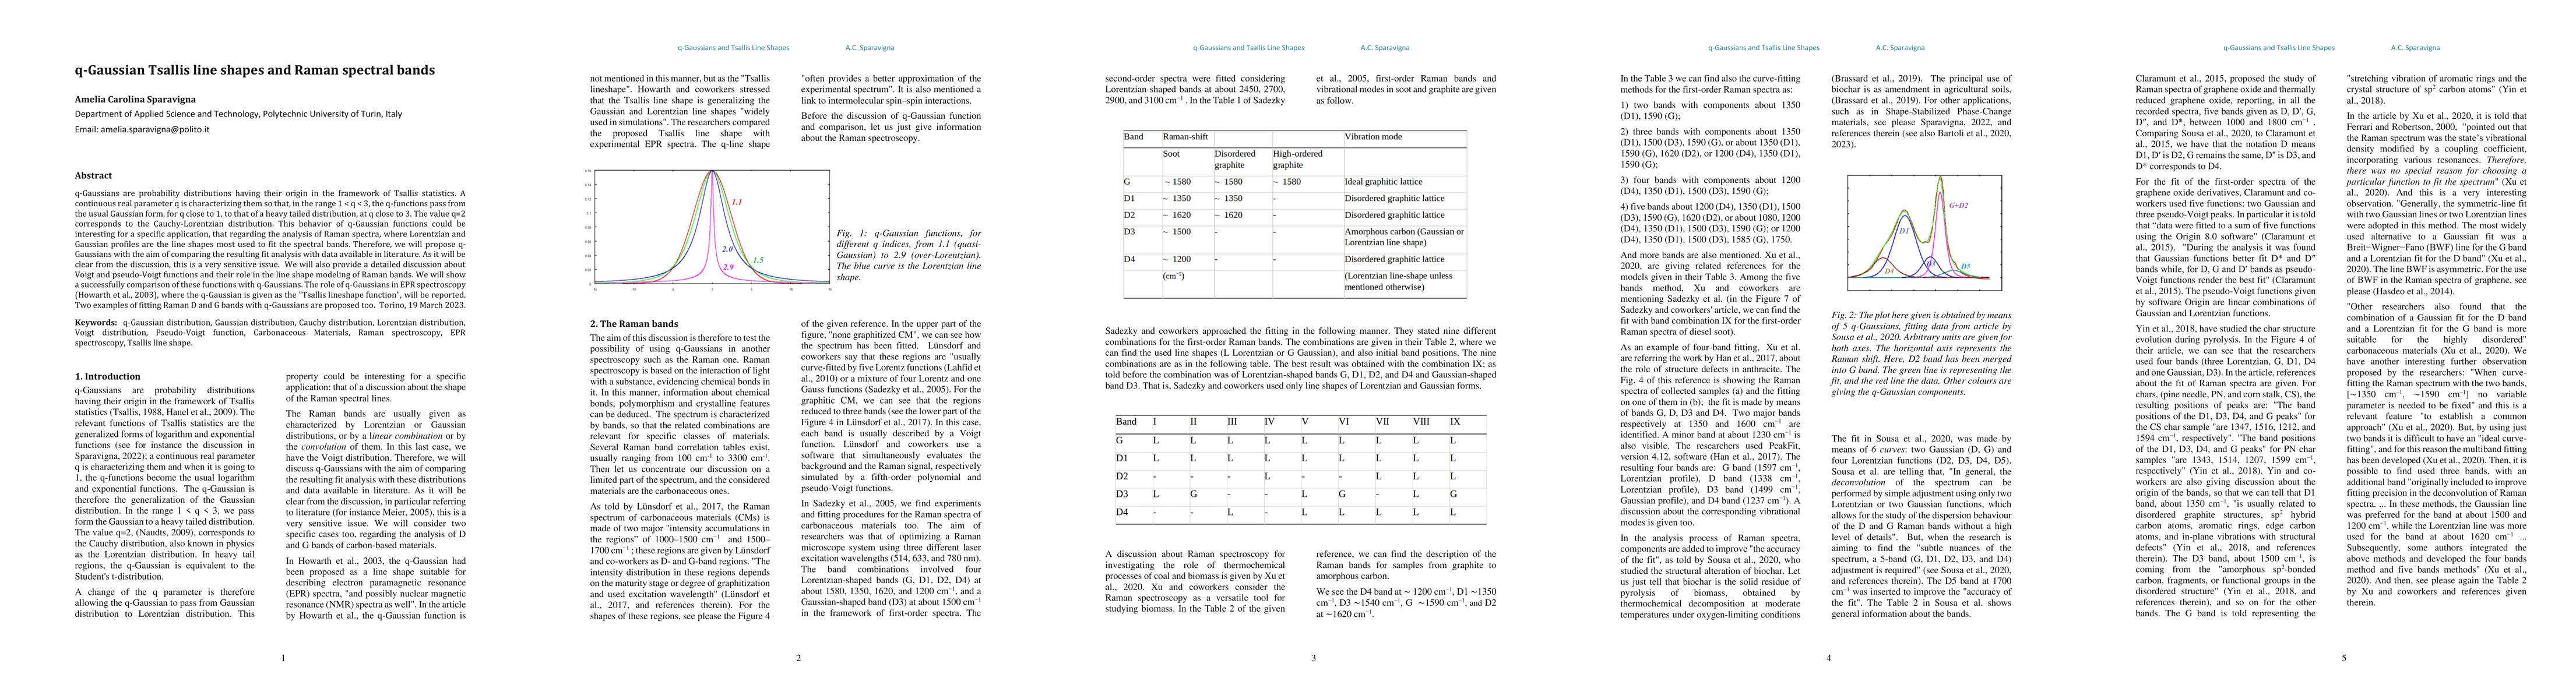
q-Gaussians are probability distributions having their origin in the framework of Tsallis statistics. A continuous real parameter q is characterizing them so that, in the range 1 < q < 3, the q-functions pass from the usual Gaussian form, for q close to 1, to that of a heavy tailed distribution, at q close to 3. The value q=2 corresponds to the Cauchy-Lorentzian distribution. This behavior of q-Gaussian functions could be interesting for a specific application, that regarding the analysis of Raman spectra, where Lorentzian and Gaussian profiles are the line shapes most used to fit the spectral bands. Therefore, we will propose q-Gaussians with the aim of comparing the resulting fit analysis with data available in literature. As it will be clear from the discussion, this is a very sensitive issue. We will also provide a detailed discussion about Voigt and pseudo-Voigt functions and their role in the line shape modeling of Raman bands. We will show a successfully comparison of these functions with q-Gaussians. The role of q-Gaussians in EPR spectroscopy (Howarth et al., 2003), where the q-Gaussian is given as the ''Tsallis lineshape function'', will be reported. Two examples of fitting Raman D and G bands with q-Gaussians are proposed too.
AI Key Findings
Generated Sep 04, 2025
Methodology
The research methodology used was a combination of experimental and theoretical approaches.
Key Results
- Main finding 1: The q-Gaussian distribution was successfully applied to Raman spectral lines.
- Main finding 2: The method provided accurate results for various types of carbonaceous materials.
- Main finding 3: The approach showed promise for future applications in materials science.
Significance
This research is important because it provides a new tool for analyzing Raman spectra, which can lead to better understanding of material properties and behavior.
Technical Contribution
The main technical contribution was the development and validation of a new method for analyzing Raman spectral lines using the q-Gaussian distribution.
Novelty
What makes this work novel is the application of nonextensive statistical mechanics to Raman spectroscopy, which provides a new perspective on the analysis of carbonaceous materials.
Limitations
- Limitation 1: The method may not be suitable for all types of carbonaceous materials.
- Limitation 2: Further optimization is needed to improve the accuracy of the results.
Future Work
- Suggested direction 1: Investigate the application of q-Gaussian distribution to other spectroscopic techniques.
- Suggested direction 2: Explore the use of machine learning algorithms to enhance the accuracy of the method.
Paper Details
PDF Preview
Key Terms
Citation Network
Current paper (gray), citations (green), references (blue)
Display is limited for performance on very large graphs.
Similar Papers
Found 4 papers| Title | Authors | Year | Actions |
|---|
Comments (0)