q-SNE: Visualizing Data using q-Gaussian Distributed Stochastic Neighbor Embedding
Publication
Metrics
AI Quick Summary
The paper introduces q-SNE, a novel dimensionality reduction technique that uses a q-Gaussian distribution for visualizing high-dimensional data, offering more flexibility than SNE and t-SNE by allowing the parameter q to optimize visualization. Performance comparisons with SNE, t-SNE, and UMAP show q-SNE's superior visualization and classification capabilities.
Paper Preview
Abstract
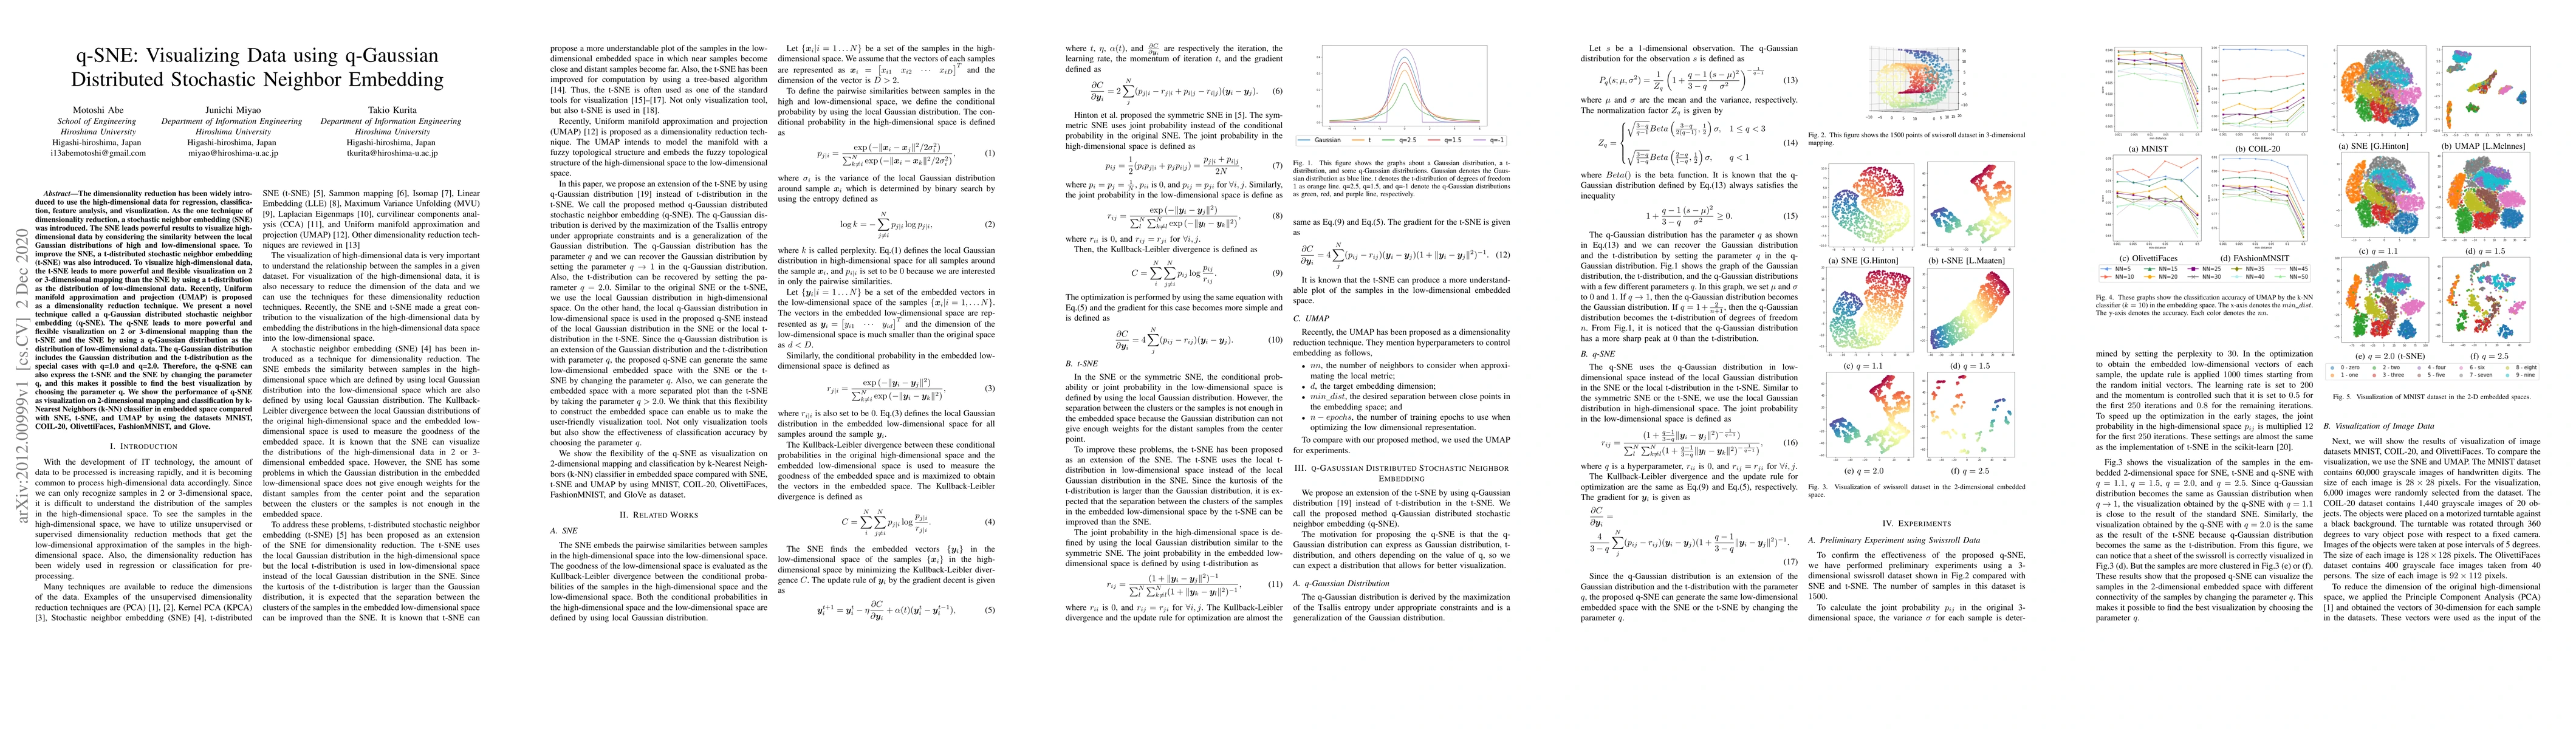
The dimensionality reduction has been widely introduced to use the high-dimensional data for regression, classification, feature analysis, and visualization. As the one technique of dimensionality reduction, a stochastic neighbor embedding (SNE) was introduced. The SNE leads powerful results to visualize high-dimensional data by considering the similarity between the local Gaussian distributions of high and low-dimensional space. To improve the SNE, a t-distributed stochastic neighbor embedding (t-SNE) was also introduced. To visualize high-dimensional data, the t-SNE leads to more powerful and flexible visualization on 2 or 3-dimensional mapping than the SNE by using a t-distribution as the distribution of low-dimensional data. Recently, Uniform manifold approximation and projection (UMAP) is proposed as a dimensionality reduction technique. We present a novel technique called a q-Gaussian distributed stochastic neighbor embedding (q-SNE). The q-SNE leads to more powerful and flexible visualization on 2 or 3-dimensional mapping than the t-SNE and the SNE by using a q-Gaussian distribution as the distribution of low-dimensional data. The q-Gaussian distribution includes the Gaussian distribution and the t-distribution as the special cases with q=1.0 and q=2.0. Therefore, the q-SNE can also express the t-SNE and the SNE by changing the parameter q, and this makes it possible to find the best visualization by choosing the parameter q. We show the performance of q-SNE as visualization on 2-dimensional mapping and classification by k-Nearest Neighbors (k-NN) classifier in embedded space compared with SNE, t-SNE, and UMAP by using the datasets MNIST, COIL-20, OlivettiFaces, FashionMNIST, and Glove.
AI Key Findings
Get AI-generated insights about this paper's methodology, results, significance, and more — seven facets brought into focus.
Impact
Paper Details
Authors
PDF Preview
Key Terms
Citation Network
Current paper (gray), citations (green), references (blue)
Display is limited for performance on very large graphs.
Discussion 0