Publication
Metrics
AI Quick Summary
This paper measures the QCD phase diagram on the lattice at strong coupling, revealing a tricritical point in the chiral limit, which may relate to the critical end point in continuum QCD. The study discusses gauge corrections and compares its findings with continuum QCD scenarios, hinting at a possible connection between the strong coupling and continuum tricritical points.
Paper Preview
Abstract
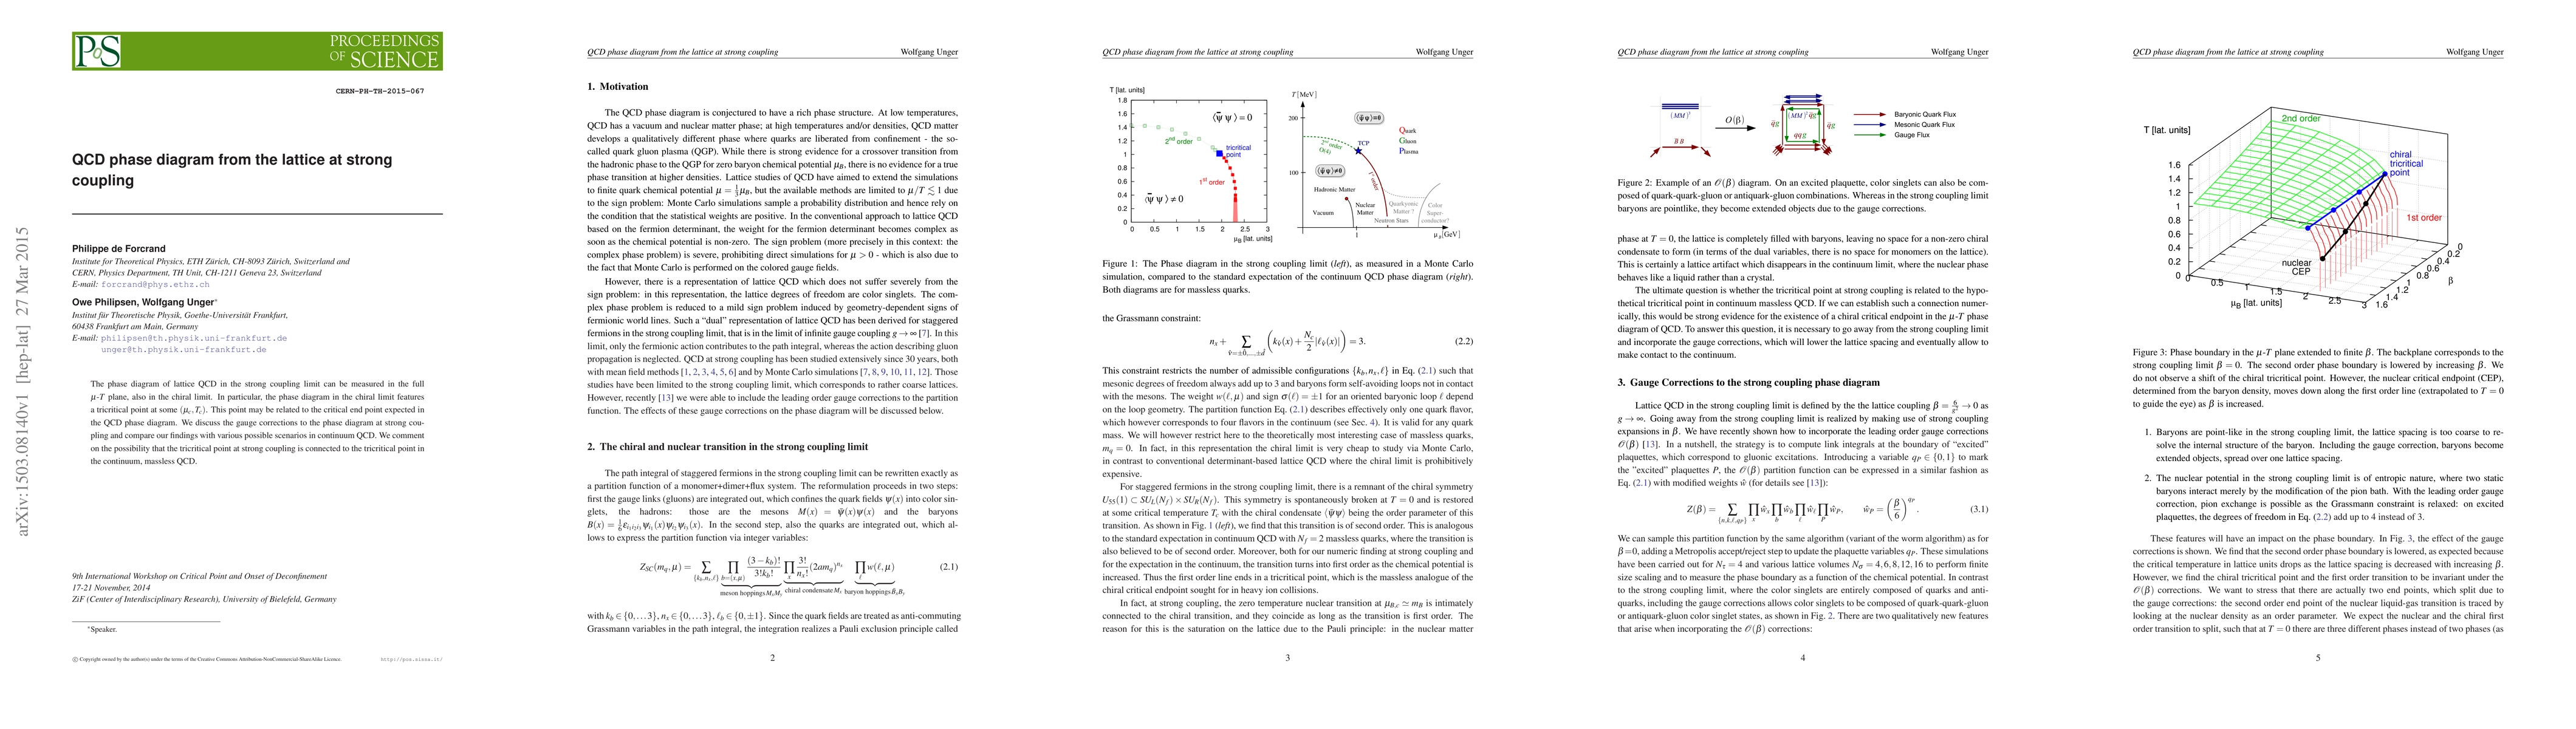
The phase diagram of lattice QCD in the strong coupling limit can be measured in the full $\mu$-$T$ plane, also in the chiral limit. In particular, the phase diagram in the chiral limit features a tricritical point at some $(\mu_c,T_c)$. This point may be related to the critical end point expected in the QCD phase diagram. We discuss the gauge corrections to the phase diagram at strong coupling and compare our findings with various possible scenarios in continuum QCD. We comment on the possibility that the tricritical point at strong coupling is connected to the tricritical point in the continuum, massless QCD.
AI Key Findings
Get AI-generated insights about this paper's methodology, results, significance, and more — seven facets brought into focus.
Impact
Paper Details
PDF Preview
Key Terms
Citation Network
Current paper (gray), citations (green), references (blue)
Display is limited for performance on very large graphs.
Discussion 0