Publication
Metrics
AI Quick Summary
This study investigates the QCD phase diagram using lattice QCD simulations, focusing on the phase boundary between hadronic and quark-gluon plasma phases, employing an imaginary chemical potential method to derive results for real chemical potential conditions.
Paper Preview
Abstract
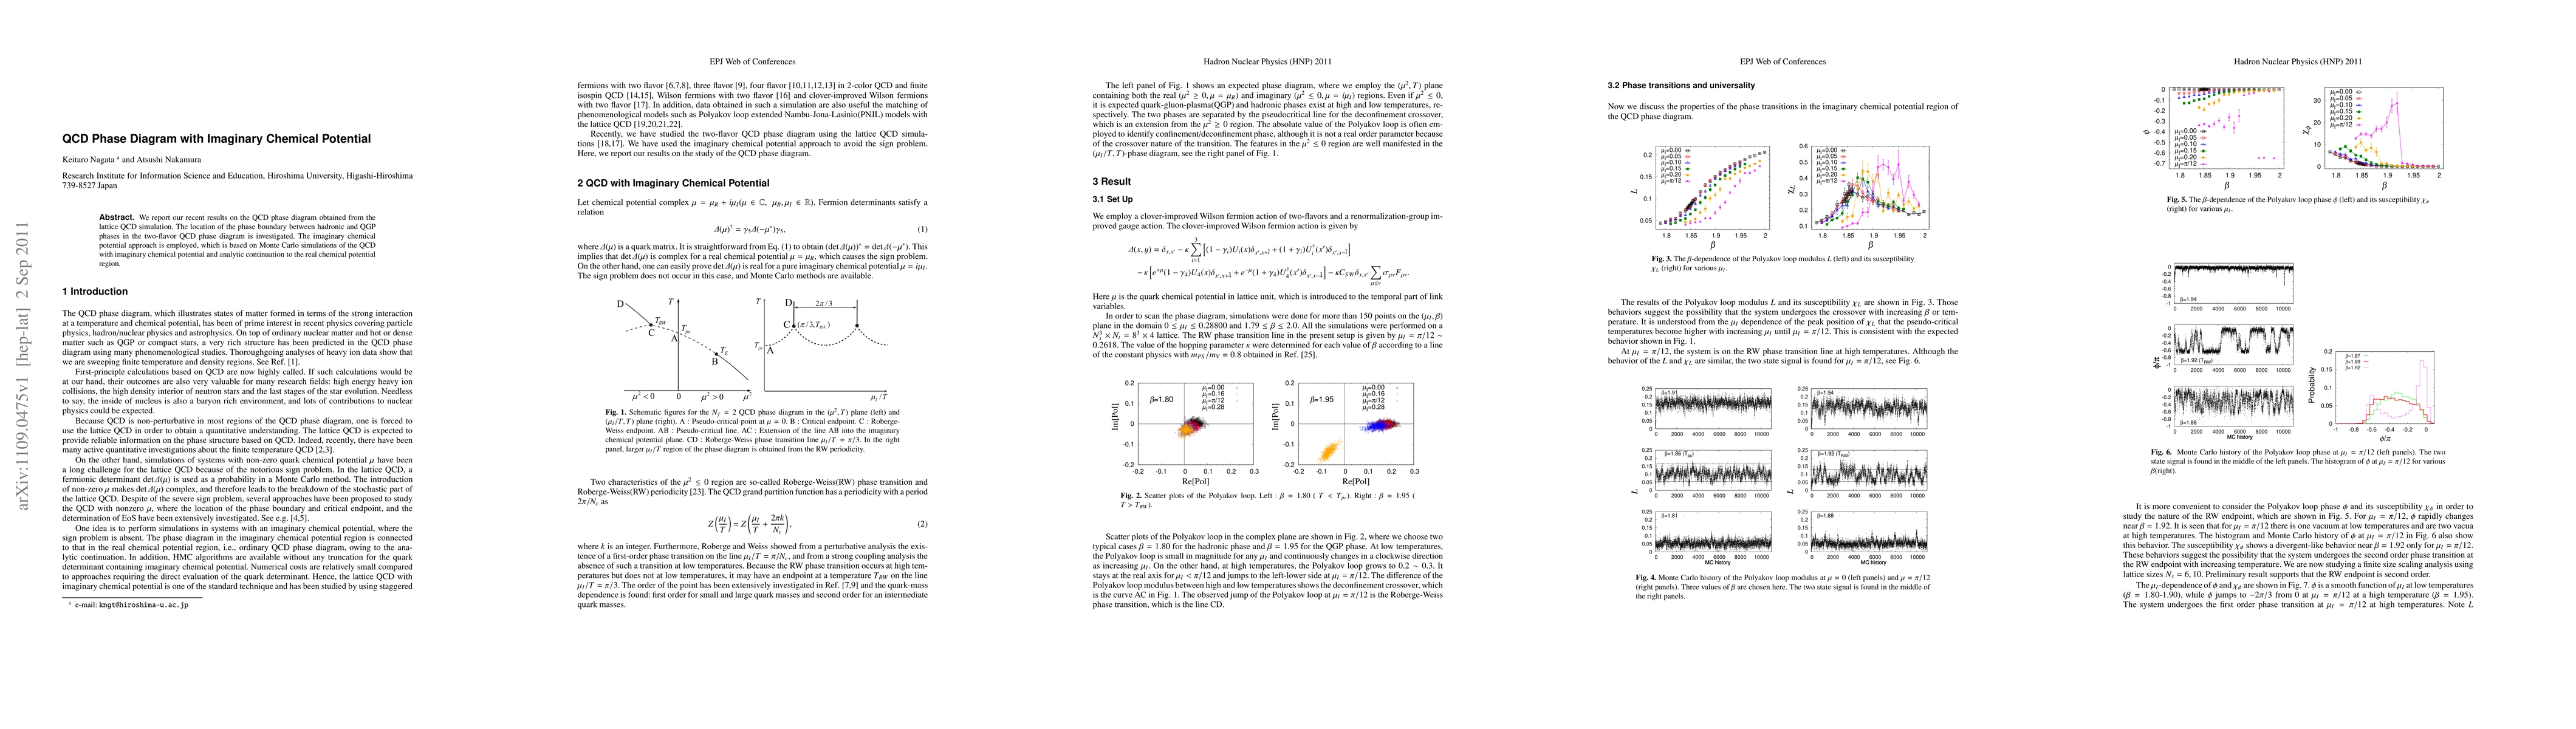
We report our recent results on the QCD phase diagram obtained from the lattice QCD simulation. The location of the phase boundary between hadronic and QGP phases in the two-flavor QCD phase diagram is investigated. The imaginary chemical potential approach is employed, which is based on Monte Carlo simulations of the QCD with imaginary chemical potential and analytic continuation to the real chemical potential region.
AI Key Findings
Get AI-generated insights about this paper's methodology, results, significance, and more — seven facets brought into focus.
Impact
Paper Details
PDF Preview
Key Terms
Citation Network
Current paper (gray), citations (green), references (blue)
Display is limited for performance on very large graphs.
Discussion 0