Publication
Metrics
AI Quick Summary
This paper uses high-resolution satellite data and cloud computing to quantify global changes in atmospheric pollutants during the COVID-19 lockdowns, revealing significant reductions in NO2, AOD, and PM 2.5 concentrations, particularly in megacities. The study highlights the utility of Google Earth Engine for real-time air quality monitoring and model validation.
Paper Preview
Abstract
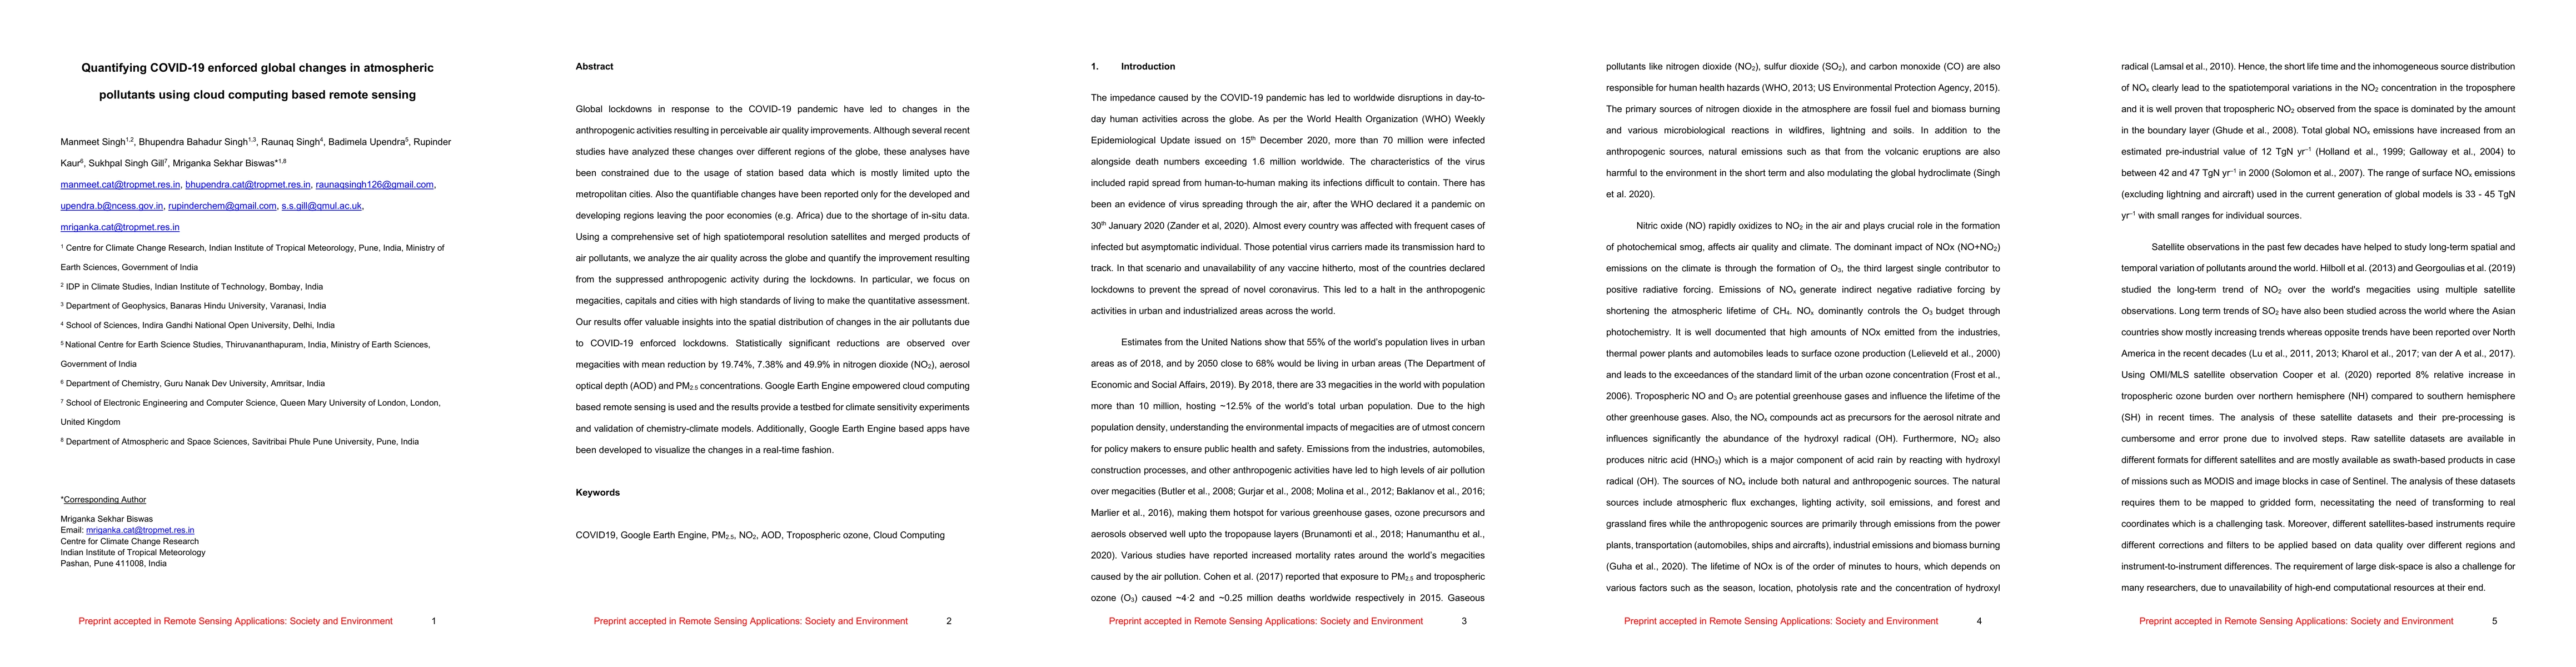
Global lockdowns in response to the COVID-19 pandemic have led to changes in the anthropogenic activities resulting in perceivable air quality improvements. Although several recent studies have analyzed these changes over different regions of the globe, these analyses have been constrained due to the usage of station-based data which is mostly limited upto the metropolitan cities. Also, the quantifiable changes have been reported only for the developed and developing regions leaving the poor economies (e.g. Africa) due to the shortage of in-situ data. Using a comprehensive set of high spatiotemporal resolution satellites and merged products of air pollutants, we analyze the air quality across the globe and quantify the improvement resulting from the suppressed anthropogenic activity during the lockdowns. In particular, we focus on megacities, capitals and cities with high standards of living to make the quantitative assessment. Our results offer valuable insights into the spatial distribution of changes in the air pollutants due to COVID-19 enforced lockdowns. Statistically significant reductions are observed over megacities with mean reduction by 19.74%, 7.38% and 49.9% in nitrogen dioxide (NO2), aerosol optical depth (AOD) and PM 2.5 concentrations. Google Earth Engine empowered cloud computing based remote sensing is used and the results provide a testbed for climate sensitivity experiments and validation of chemistry-climate models. Additionally, Google Earth Engine based apps have been developed to visualize the changes in a real-time fashion.
AI Key Findings
Get AI-generated insights about this paper's methodology, results, significance, and more — seven facets brought into focus.
Impact
Paper Details
PDF Preview
Key Terms
Citation Network
Current paper (gray), citations (green), references (blue)
Display is limited for performance on very large graphs.
Discussion 0