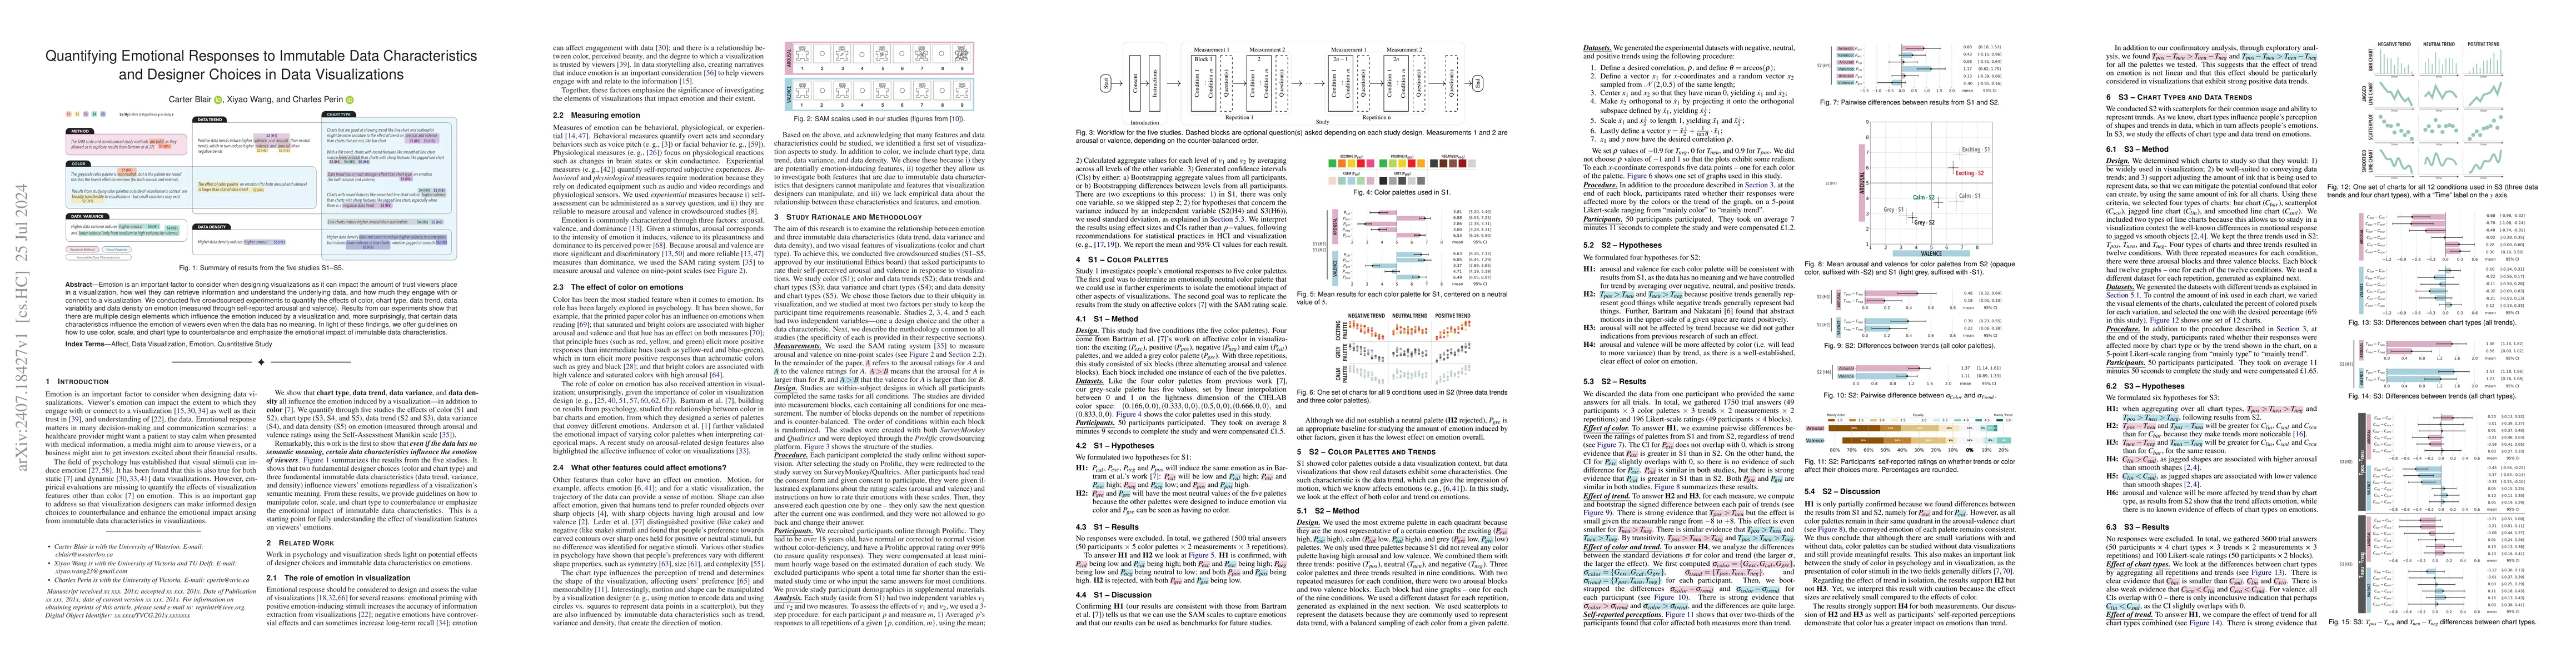
Quantifying Emotional Responses to Immutable Data Characteristics and Designer Choices in Data Visualizations
Publication
Metrics
AI Quick Summary
This study investigates how various design elements and immutable data characteristics in visualizations affect viewers' emotions, measured by arousal and valence. Experiments reveal that factors like color and chart type significantly influence emotional responses, even when the data lacks intrinsic meaning, prompting guidelines for managing emotional impacts in data visualization design.
Paper Preview
Abstract
Emotion is an important factor to consider when designing visualizations as it can impact the amount of trust viewers place in a visualization, how well they can retrieve information and understand the underlying data, and how much they engage with or connect to a visualization. We conducted five crowdsourced experiments to quantify the effects of color, chart type, data trend, data variability and data density on emotion (measured through self-reported arousal and valence). Results from our experiments show that there are multiple design elements which influence the emotion induced by a visualization and, more surprisingly, that certain data characteristics influence the emotion of viewers even when the data has no meaning. In light of these findings, we offer guidelines on how to use color, scale, and chart type to counterbalance and emphasize the emotional impact of immutable data characteristics.
AI Key Findings
Get AI-generated insights about this paper's methodology, results, significance, and more — seven facets brought into focus.
Impact
Paper Details
Authors
PDF Preview
Citation Network
Current paper (gray), citations (green), references (blue)
Display is limited for performance on very large graphs.
Discussion 0