Quantitative analysis of cryptocurrencies transaction graph
Publication
Metrics
AI Quick Summary
This study quantitatively analyzes the transaction graphs of Bitcoin, Ethereum, Litecoin, Dash, and Z-Cash to compare their dynamic properties over time. The research finds that the growth rate and density of transaction graphs correlate with the price of cryptocurrencies, and these graphs exhibit non-assortative mixing and follow a power law degree distribution.
Paper Preview
Abstract
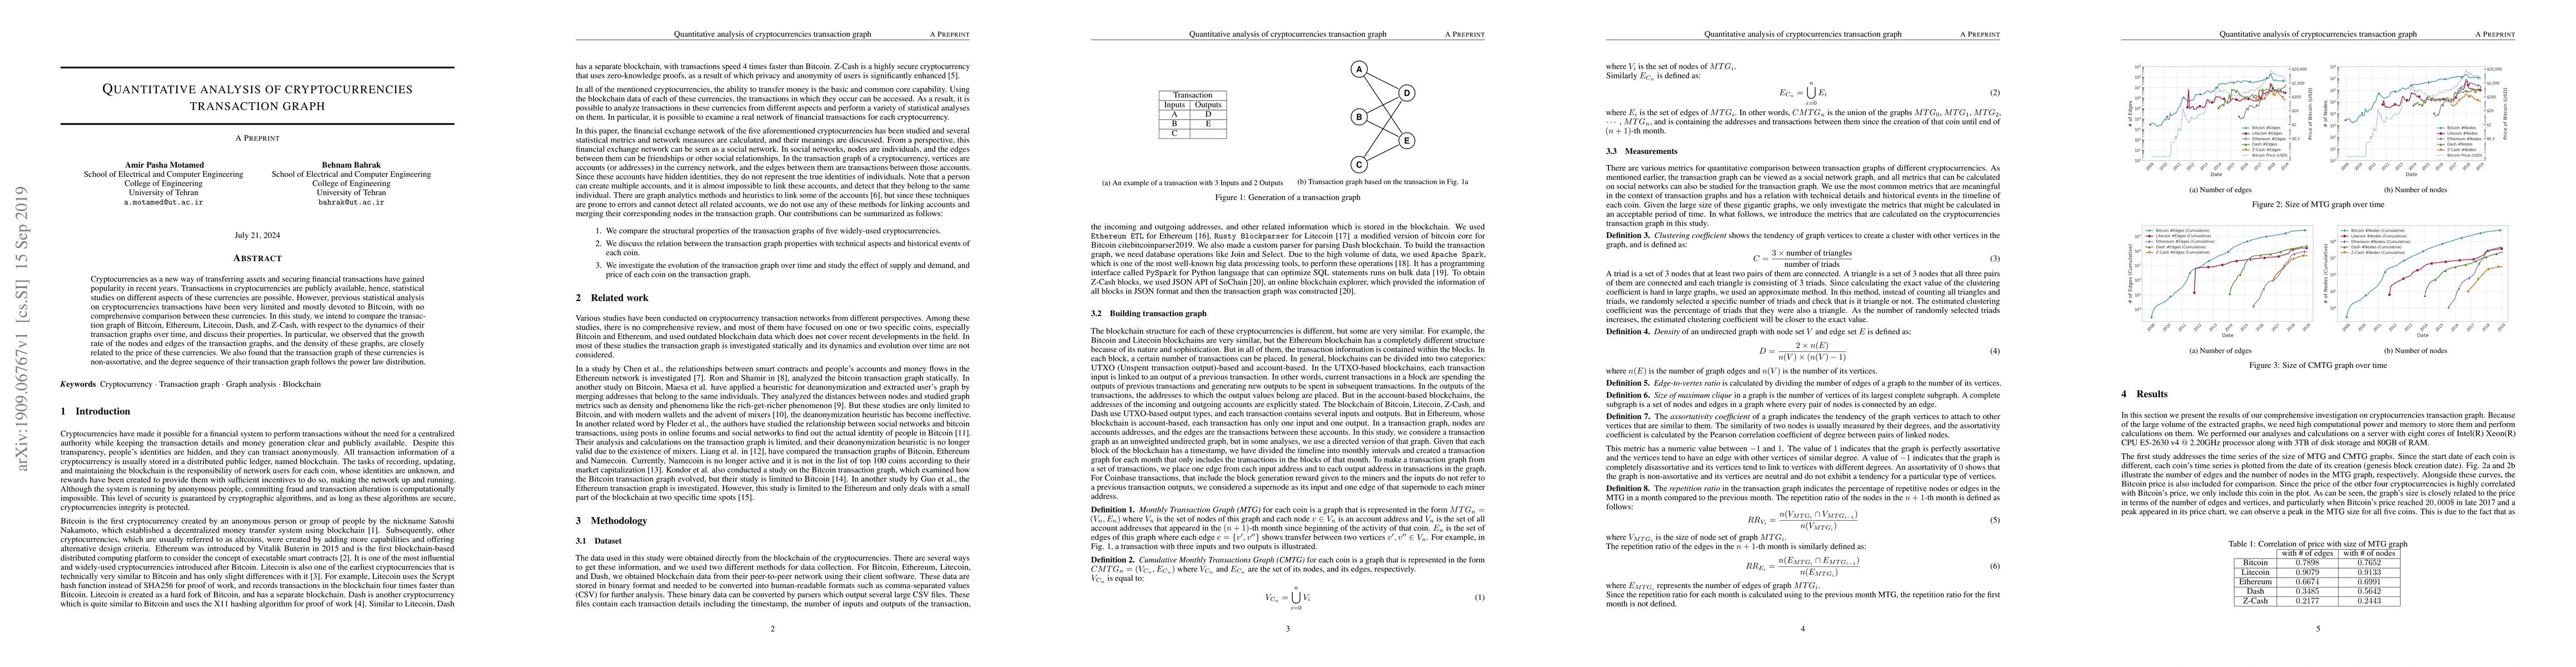
Cryptocurrencies as a new way of transferring assets and securing financial transactions have gained popularity in recent years. Transactions in cryptocurrencies are publicly available, hence, statistical studies on different aspects of these currencies are possible. However, previous statistical analysis on cryptocurrencies transactions have been very limited and mostly devoted to Bitcoin, with no comprehensive comparison between these currencies. In this study, we intend to compare the transaction graph of Bitcoin, Ethereum, Litecoin, Dash, and Z-Cash, with respect to the dynamics of their transaction graphs over time, and discuss their properties. In particular, we observed that the growth rate of the nodes and edges of the transaction graphs, and the density of these graphs, are closely related to the price of these currencies. We also found that the transaction graph of these currencies is non-assortative, and the degree sequence of their transaction graph follows the power law distribution.
AI Key Findings — Failed
Key findings generation failed. Failed to start generation process
Impact
Paper Details
Authors
PDF Preview
Key Terms
Citation Network
Current paper (gray), citations (green), references (blue)
Display is limited for performance on very large graphs.
Discussion 0